PNC Bank 2008 Annual Report Download - page 109
Download and view the complete annual report
Please find page 109 of the 2008 PNC Bank annual report below. You can navigate through the pages in the report by either clicking on the pages listed below, or by using the keyword search tool below to find specific information within the annual report.-
 1
1 -
2
-
3
-
4
-
5
-
6
-
7
-
8
-
9
-
10
-
11
-
12
-
13
-
14
-
15
-
16
-
17
-
18
-
19
-
20
-
21
-
22
-
23
-
24
-
25
-
26
-
27
-
28
-
29
-
30
-
31
-
32
-
33
-
34
-
35
-
36
-
37
-
38
-
39
-
40
-
41
-
42
-
43
-
44
-
45
-
46
-
47
-
48
-
49
-
50
-
51
-
52
-
53
-
54
-
55
-
56
-
57
-
58
-
59
-
60
-
61
-
62
-
63
-
64
-
65
-
66
-
67
-
68
-
69
-
70
-
71
-
72
-
73
-
74
-
75
-
76
-
77
-
78
-
79
-
80
-
81
-
82
-
83
-
84
-
85
-
86
-
87
-
88
-
89
-
90
-
91
-
92
-
93
-
94
-
95
-
96
-
97
-
98
-
 99
99 -
 100
100 -
 101
101 -
 102
102 -
 103
103 -
 104
104 -
 105
105 -
 106
106 -
 107
107 -
 108
108 -
 109
109 -
 110
110 -
 111
111 -
 112
112 -
 113
113 -
 114
114 -
 115
115 -
 116
116 -
 117
117 -
 118
118 -
 119
119 -
120
-
121
-
122
-
123
-
124
-
125
-
126
-
127
-
128
-
129
-
130
-
131
-
132
-
133
-
134
-
135
-
136
-
137
-
138
-
139
-
140
-
141
-
142
-
143
-
144
-
145
-
146
-
147
-
148
-
149
-
150
-
151
-
152
-
153
-
154
-
155
-
156
-
157
-
158
-
159
-
160
-
161
-
162
-
163
-
164
-
165
-
166
-
167
-
168
-
169
-
170
-
171
-
172
-
173
-
174
-
175
-
176
-
177
-
178
-
179
-
180
-
181
-
182
-
183
-
184
 |
 |

N
OTE
5A
SSET
Q
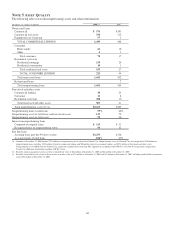
UALITY
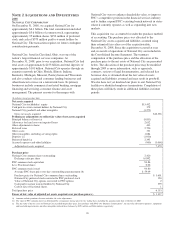
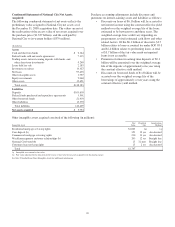
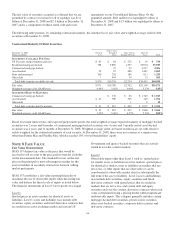
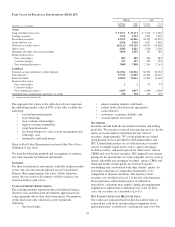
The following table sets forth nonperforming assets and related information:
December 31 - dollars in millions 2008 (a) 2007
Nonaccrual loans
Commercial $ 576 $193
Commercial real estate 766 212
Equipment lease financing 97 3
TOTAL COMMERCIAL LENDING 1,439 408
Consumer
Home equity 66 16
Other 41
Total consumer 70 17
Residential real estate
Residential mortgage 139 26
Residential construction 14 1
Total residential real estate 153 27
TOTAL CONSUMER LENDING 223 44
Total nonaccrual loans 1,662 452
Restructured loans 2
Total nonperforming loans 1,662 454
Foreclosed and other assets
Commercial lending 34 23
Consumer 11 8
Residential real estate 458 10
Total foreclosed and other assets 503 41
Total nonperforming assets (b) (c) $2,165 $495
Nonperforming loans to total loans .95% .66%
Nonperforming assets to total loans and foreclosed assets 1.23 .72
Nonperforming assets to total assets .74 .36
Interest on nonperforming loans
Computed on original terms $ 115 $51
Recognized prior to nonperforming status 60 32
Past due loans
Accruing loans past due 90 days or more $3,259 $136
As a percentage of total loans 1.86% .20%
(a) Amounts at December 31, 2008 include $722 million of nonperforming assets related to National City. Nonperforming assets of National City are comprised of $250 million of
nonperforming loans, including $154 million related to commercial lending and $96 million related to consumer lending, and $472 million of foreclosed and other assets.
Nonperforming assets added with the National City acquisition excluded those loans that PNC impaired in accordance with SOP 03-3. See Note 6 Certain Loans Acquired in a
Transfer for additional information regarding SOP 03-3 loans.
(b) Excludes equity management assets carried at estimated fair value of $42 million at December 31, 2008 and $4 million at December 31, 2007.
(c) Excludes loans held for sale carried at lower of cost or market value of $78 million at December 31, 2008 and $25 million at December 31, 2007, including troubled debt restructured
assets of $5 million at December 31, 2008.
105