PNC Bank 2008 Annual Report Download - page 159
Download and view the complete annual report
Please find page 159 of the 2008 PNC Bank annual report below. You can navigate through the pages in the report by either clicking on the pages listed below, or by using the keyword search tool below to find specific information within the annual report.-
 1
1 -
2
-
3
-
4
-
5
-
6
-
7
-
8
-
9
-
10
-
11
-
12
-
13
-
14
-
15
-
16
-
17
-
18
-
19
-
20
-
21
-
22
-
23
-
24
-
25
-
26
-
27
-
28
-
29
-
30
-
31
-
32
-
33
-
34
-
35
-
36
-
37
-
38
-
39
-
40
-
41
-
42
-
43
-
44
-
45
-
46
-
47
-
48
-
49
-
50
-
51
-
52
-
53
-
54
-
55
-
56
-
57
-
58
-
59
-
60
-
61
-
62
-
63
-
64
-
65
-
66
-
67
-
68
-
69
-
70
-
71
-
72
-
73
-
74
-
75
-
76
-
77
-
78
-
79
-
80
-
81
-
82
-
83
-
84
-
85
-
86
-
87
-
88
-
89
-
90
-
91
-
92
-
93
-
94
-
95
-
96
-
97
-
98
-
99
-
100
-
101
-
102
-
103
-
104
-
105
-
106
-
107
-
108
-
109
-
110
-
111
-
112
-
113
-
114
-
115
-
116
-
117
-
118
-
119
-
120
-
121
-
122
-
123
-
124
-
125
-
126
-
127
-
128
-
129
-
130
-
131
-
132
-
133
-
134
-
135
-
136
-
137
-
138
-
139
-
140
-
141
-
142
-
143
-
144
-
145
-
146
-
147
-
148
-
 149
149 -
 150
150 -
 151
151 -
 152
152 -
 153
153 -
 154
154 -
 155
155 -
 156
156 -
 157
157 -
 158
158 -
 159
159 -
 160
160 -
 161
161 -
 162
162 -
 163
163 -
 164
164 -
 165
165 -
 166
166 -
 167
167 -
 168
168 -
 169
169 -
170
-
171
-
172
-
173
-
174
-
175
-
176
-
177
-
178
-
179
-
180
-
181
-
182
-
183
-
184
 |
 |

S
TATISTICAL
I
NFORMATION
(U
NAUDITED
)
THE PNC FINANCIAL SERVICES GROUP, INC.
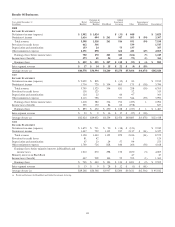
Selected Quarterly Financial Data
Dollars in millions,
except per share data
2008 2007
Fourth Third Second First Fourth Third Second First
Summary of Operations
Interest income $1,543 $1,574 $1,577 $1,619 $1,670 $1,627 $1,554 $1,315
Interest expense 551 574 600 765 877 866 816 692
Net interest income 992 1,000 977 854 793 761 738 623
Noninterest income (a) 684 654 1,062 967 834 990 975 991
Total revenue 1,676 1,654 2,039 1,821 1,627 1,751 1,713 1,614
Provision for credit losses (b) 990 190 186 151 188 65 54 8
Noninterest expense 1,131 1,142 1,115 1,042 1,213 1,099 1,040 944
Income (loss) before income taxes (445) 322 738 628 226 587 619 662
Income taxes (benefit) (197) 74 233 251 48 180 196 203
Net income (loss) $ (248) $ 248 $ 505 $ 377 $ 178 $ 407 $ 423 $ 459
Per Common Share Data
Book value $39.44 $39.44 $42.17 $42.26 $43.60 $43.12 $42.36 $42.63
Basic earnings (c) (.77) .72 1.47 1.11 .53 1.21 1.24 1.49
Diluted earnings (c) (.77) .71 1.45 1.09 .52 1.19 1.22 1.46
(a) Noninterest income included equity management gains /(losses) and net securities gains/(losses) in each quarter as follows (in millions):
2008 2007
Fourth Third Second First Fourth Third Second First
Equity management gains/(losses) $ (16) $ (24) $ (7) $ 23 $21$47$ 2$32
Net securities gains/(losses) (172) (74) (1) 41 (1) (2) 1 (3)
(b) The fourth quarter 2008 provision for credit losses included a $504 million conforming provision for credit losses related to our acquisition of National City.
(c) The sum of quarterly amounts for 2008 and 2007 does not equal the respective year’s amount because the quarterly calculations are based on a changing number of average shares.
155