PNC Bank 2008 Annual Report Download - page 72
Download and view the complete annual report
Please find page 72 of the 2008 PNC Bank annual report below. You can navigate through the pages in the report by either clicking on the pages listed below, or by using the keyword search tool below to find specific information within the annual report.-
 1
1 -
2
-
3
-
4
-
5
-
6
-
7
-
8
-
9
-
10
-
11
-
12
-
13
-
14
-
15
-
16
-
17
-
18
-
19
-
20
-
21
-
22
-
23
-
24
-
25
-
26
-
27
-
28
-
29
-
30
-
31
-
32
-
33
-
34
-
35
-
36
-
37
-
38
-
39
-
40
-
41
-
42
-
43
-
44
-
45
-
46
-
47
-
48
-
49
-
50
-
51
-
52
-
53
-
54
-
55
-
56
-
57
-
58
-
59
-
60
-
61
-
 62
62 -
 63
63 -
 64
64 -
 65
65 -
 66
66 -
 67
67 -
 68
68 -
 69
69 -
 70
70 -
 71
71 -
 72
72 -
 73
73 -
 74
74 -
 75
75 -
 76
76 -
 77
77 -
 78
78 -
 79
79 -
 80
80 -
 81
81 -
 82
82 -
83
-
84
-
85
-
86
-
87
-
88
-
89
-
90
-
91
-
92
-
93
-
94
-
95
-
96
-
97
-
98
-
99
-
100
-
101
-
102
-
103
-
104
-
105
-
106
-
107
-
108
-
109
-
110
-
111
-
112
-
113
-
114
-
115
-
116
-
117
-
118
-
119
-
120
-
121
-
122
-
123
-
124
-
125
-
126
-
127
-
128
-
129
-
130
-
131
-
132
-
133
-
134
-
135
-
136
-
137
-
138
-
139
-
140
-
141
-
142
-
143
-
144
-
145
-
146
-
147
-
148
-
149
-
150
-
151
-
152
-
153
-
154
-
155
-
156
-
157
-
158
-
159
-
160
-
161
-
162
-
163
-
164
-
165
-
166
-
167
-
168
-
169
-
170
-
171
-
172
-
173
-
174
-
175
-
176
-
177
-
178
-
179
-
180
-
181
-
182
-
183
-
184
 |
 |

The decline in total trading revenue for 2008 primarily related
to losses sustained in our proprietary trading activities. These
decreases reflected the negative impact of significant
widening of market credit spreads in extremely illiquid
markets. We took the following steps during 2008 to reduce
our proprietary trading positions:
• Sold Hilliard Lyons on March 31, 2008, including
their proprietary trading positions;
• Significantly reduced the PNC Capital Markets
municipal bond arbitrage book during the first half of
2008, closing it completely by August 2008;
• Reduced significantly proprietary risk taking within
the customer-focused equity derivatives book during
2008;
• Reduced convertible arbitrage book positions during
2008 from close to $225 million face value of bonds
to close to $100 million;
• Terminated all derivative positions hedging
municipal bond exposure in tender option bond
trusts, terminated the trusts, and transferred the
remaining long municipal bond position
(approximately $300 million face value) to the
available for sale portfolio. This transfer occurred in
the fourth quarter of 2008;
• Sold down approximately 80% of the positions in the
non-agency mortgage-backed securities and
commercial mortgage-backed securities proprietary
trading books during 2008. The remaining positions
(market value of approximately $300 million) were
transferred to the available for sale portfolio after
terminating swap hedges. This transfer occurred in
the fourth quarter of 2008; and
• Significantly reduced all other proprietary trading
positions including interest rate swaps, futures, swap
options and credit default swaps.
Trading securities at December 31, 2008 totaled $1.7 billion,
including $1 billion from National City, compared with $3.6
billion at December 31, 2007 and reflected our risk
management actions outlined above.
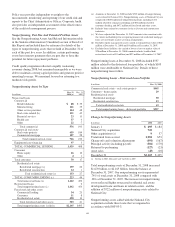
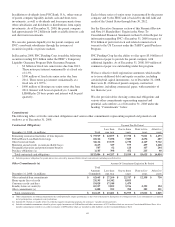
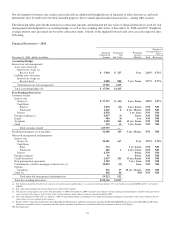
Average trading assets and liabilities for the past three years
consisted of the following:
Year ended - in millions 2008 2007 2006
Assets
Securities (a) $2,387 $2,708 $1,712
Resale agreements (b) 1,794 1,133 623
Financial derivatives (c) 2,389 1,378 1,148
Loans at fair value (c) 83 166 128
Total assets $6,653 $5,385 $3,611
Liabilities
Securities sold short (d) $1,294 $1,657 $ 965
Repurchase agreements
and other borrowings (e) 756 520 833
Financial derivatives (f) 2,423 1,384 1,103
Borrowings at fair value (f) 22 39 31
Total liabilities $4,495 $3,600 $2,932
(a) Included in Interest-earning assets-Other on the Average Consolidated Balance
Sheet And Net Interest Analysis.
(b) Included in Federal funds sold and resale agreements.
(c) Included in Noninterest-earning assets-Other.
(d) Included in Other borrowed funds.
(e) Included in Repurchase agreements and Other borrowed funds.
(f) Included in Accrued expenses and other liabilities.
M
ARKET
R
ISK
M
ANAGEMENT
–E
QUITY
A
ND
O
THER
I
NVESTMENT
R
ISK
Equity investment risk is the risk of potential losses associated
with investing in both private and public equity markets. In
addition to extending credit, taking deposits, and underwriting
and trading financial instruments, we make and manage direct
investments in a variety of transactions, including
management buyouts, recapitalizations, and later-stage growth
financings in a variety of industries. We also have investments
in affiliated and non-affiliated funds that make similar
investments in private equity and in debt and equity-oriented
hedge funds. The economic and/or book value of these
investments and other assets such as loan servicing rights are
directly affected by changes in market factors.
The primary risk measurement for equity and other
investments is economic capital. Economic capital is a
common measure of risk for credit, market and operational
risk. It is an estimate of the worst-case value depreciation over
one year within a 99.9% confidence level. Given the illiquid
nature of many of these types of investments, it can be a
challenge to determine their fair values. Market Risk
Management and Finance provide independent oversight of
the valuation process.
Various PNC business units manage our private equity and
other investment activities. Our businesses are responsible for
making investment decisions within the approved policy limits
and associated guidelines.
BlackRock
PNC owns approximately 43 million shares of BlackRock
common stock, accounted for under the equity method. Our
total investment in BlackRock was $4.2 billion at
December 31, 2008 compared with $4.1 billion at
December 31, 2007. The market value of our investment in
BlackRock was $5.8 billion at December 31, 2008. The
primary risk measurement, similar to other equity investments,
is economic capital.
The discussion of BlackRock within the Business Segments
Review section of this Item 7 includes information about
changes in our ownership structure of BlackRock in 2009.
Tax Credit Investments
Included in our equity investments are limited partnerships
that sponsor tax credit investments. These investments,
consisting of partnerships as well as equity investments held
by consolidated partnerships, totaled $2.3 billion at
December 31, 2008. Investments accounted for under the
68