PNC Bank 2008 Annual Report Download - page 25
Download and view the complete annual report
Please find page 25 of the 2008 PNC Bank annual report below. You can navigate through the pages in the report by either clicking on the pages listed below, or by using the keyword search tool below to find specific information within the annual report.-
 1
1 -
2
-
3
-
4
-
5
-
6
-
7
-
8
-
9
-
10
-
11
-
12
-
13
-
14
-
 15
15 -
 16
16 -
 17
17 -
 18
18 -
 19
19 -
 20
20 -
 21
21 -
 22
22 -
 23
23 -
 24
24 -
 25
25 -
 26
26 -
 27
27 -
 28
28 -
 29
29 -
 30
30 -
 31
31 -
 32
32 -
 33
33 -
 34
34 -
 35
35 -
36
-
37
-
38
-
39
-
40
-
41
-
42
-
43
-
44
-
45
-
46
-
47
-
48
-
49
-
50
-
51
-
52
-
53
-
54
-
55
-
56
-
57
-
58
-
59
-
60
-
61
-
62
-
63
-
64
-
65
-
66
-
67
-
68
-
69
-
70
-
71
-
72
-
73
-
74
-
75
-
76
-
77
-
78
-
79
-
80
-
81
-
82
-
83
-
84
-
85
-
86
-
87
-
88
-
89
-
90
-
91
-
92
-
93
-
94
-
95
-
96
-
97
-
98
-
99
-
100
-
101
-
102
-
103
-
104
-
105
-
106
-
107
-
108
-
109
-
110
-
111
-
112
-
113
-
114
-
115
-
116
-
117
-
118
-
119
-
120
-
121
-
122
-
123
-
124
-
125
-
126
-
127
-
128
-
129
-
130
-
131
-
132
-
133
-
134
-
135
-
136
-
137
-
138
-
139
-
140
-
141
-
142
-
143
-
144
-
145
-
146
-
147
-
148
-
149
-
150
-
151
-
152
-
153
-
154
-
155
-
156
-
157
-
158
-
159
-
160
-
161
-
162
-
163
-
164
-
165
-
166
-
167
-
168
-
169
-
170
-
171
-
172
-
173
-
174
-
175
-
176
-
177
-
178
-
179
-
180
-
181
-
182
-
183
-
184
 |
 |

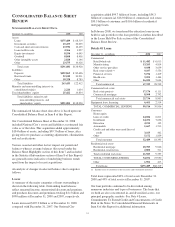
ITEM
6–
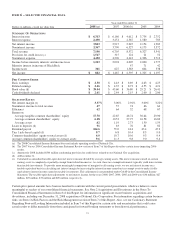
SELECTED FINANCIAL DATA
Dollars in millions, except per share data
Year ended December 31
2008 (a) 2007 2006 (b) 2005 2004
S
UMMARY
O
F
O
PERATIONS
Interest income $ 6,313 $ 6,166 $ 4,612 $ 3,734 $ 2,752
Interest expense 2,490 3,251 2,367 1,580 783
Net interest income 3,823 2,915 2,245 2,154 1,969
Noninterest income 3,367 3,790 6,327 4,173 3,572
Total revenue 7,190 6,705 8,572 6,327 5,541
Provision for credit losses (c) 1,517 315 124 21 52
Noninterest expense 4,430 4,296 4,443 4,306 3,712
Income before minority interests and income taxes 1,243 2,094 4,005 2,000 1,777
Minority interest in income of BlackRock 47 71 42
Income taxes 361 627 1,363 604 538
Net income $ 882 $ 1,467 $ 2,595 $ 1,325 $ 1,197
P
ER
C
OMMON
S
HARE
Basic earnings $ 2.50 $ 4.43 $ 8.89 $ 4.63 $ 4.25
Diluted earnings $ 2.46 $ 4.35 $ 8.73 $ 4.55 $ 4.21
Book value (d) $ 39.44 $ 43.60 $ 36.80 $ 29.21 $ 26.41
Cash dividends declared $ 2.61 $ 2.44 $ 2.15 $ 2.00 $ 2.00
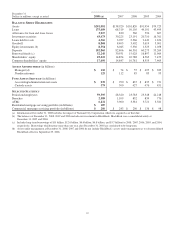
S
ELECTED
R
ATIOS
Net interest margin (e) 3.37% 3.00% 2.92% 3.00% 3.22%
Noninterest income to total revenue 47 57 74 66 64
Efficiency 62 64 52 68 67
Return on
Average tangible common shareholders’ equity 17.70 22.65 48.74 30.64 29.90
Average common shareholders’ equity 6.28 10.53 27.97 16.58 16.82
Average assets .62 1.19 2.73 1.50 1.59
Loans to deposits (d) 91 83 76 81 82
Dividend payout 104.6 55.0 24.4 43.4 47.2
Tier 1 risk-based capital (d) 9.7 6.8 10.4 8.3 9.0
Common shareholders’ equity to total assets (d) 6.0 10.7 10.6 9.3 9.4
Average common shareholders’ equity to average assets 9.6 11.3 9.8 9.0 9.4
(a) The 2008 Consolidated Income Statement does not include operating results of National City.
(b) The 2007 Versus 2006 Consolidated Income Statement Review section of Item 7 of this Report describes certain items impacting 2006
results.
(c) Amount for 2008 included $504 million conforming provision for credit losses related to our National City acquisition.
(d) At December 31.
(e) Calculated as annualized taxable-equivalent net interest income divided by average earning assets. The interest income earned on certain
earning assets is completely or partially exempt from federal income tax. As such, these tax-exempt instruments typically yield lower returns
than taxable investments. To provide more meaningful comparisons of margins for all earning assets, we use net interest income on a
taxable-equivalent basis in calculating net interest margin by increasing the interest income earned on tax-exempt assets to make it fully
equivalent to interest income earned on taxable investments. This adjustment is not permitted under GAAP in the Consolidated Income
Statement. The taxable-equivalent adjustments to net interest income for the years 2008, 2007, 2006, 2005 and 2004 were $36 million, $27
million, $25 million, $33 million and $20 million, respectively.
Certain prior-period amounts have been reclassified to conform with the current period presentation, which we believe is more
meaningful to readers of our consolidated financial statements. See Note 2 Acquisitions and Divestitures in the Notes To
Consolidated Financial Statements in Item 8 of this Report for information on significant recent business acquisitions and
divestitures, including our December 31, 2008 acquisition of National City Corporation. For information regarding certain business
risks, see Item 1A Risk Factors and the Risk Management section of Item 7 of this Report. Also, see our Cautionary Statement
Regarding Forward-Looking Information included in Item 7 of this Report for certain risks and uncertainties that could cause
actual results to differ materially from those anticipated in forward-looking statements or from historical performance.
21