PNC Bank 2008 Annual Report Download - page 30
Download and view the complete annual report
Please find page 30 of the 2008 PNC Bank annual report below. You can navigate through the pages in the report by either clicking on the pages listed below, or by using the keyword search tool below to find specific information within the annual report.-
 1
1 -
2
-
3
-
4
-
5
-
6
-
7
-
8
-
9
-
10
-
11
-
12
-
13
-
14
-
15
-
16
-
17
-
18
-
19
-
 20
20 -
 21
21 -
 22
22 -
 23
23 -
 24
24 -
 25
25 -
 26
26 -
 27
27 -
 28
28 -
 29
29 -
 30
30 -
 31
31 -
 32
32 -
 33
33 -
 34
34 -
 35
35 -
 36
36 -
 37
37 -
 38
38 -
 39
39 -
 40
40 -
41
-
42
-
43
-
44
-
45
-
46
-
47
-
48
-
49
-
50
-
51
-
52
-
53
-
54
-
55
-
56
-
57
-
58
-
59
-
60
-
61
-
62
-
63
-
64
-
65
-
66
-
67
-
68
-
69
-
70
-
71
-
72
-
73
-
74
-
75
-
76
-
77
-
78
-
79
-
80
-
81
-
82
-
83
-
84
-
85
-
86
-
87
-
88
-
89
-
90
-
91
-
92
-
93
-
94
-
95
-
96
-
97
-
98
-
99
-
100
-
101
-
102
-
103
-
104
-
105
-
106
-
107
-
108
-
109
-
110
-
111
-
112
-
113
-
114
-
115
-
116
-
117
-
118
-
119
-
120
-
121
-
122
-
123
-
124
-
125
-
126
-
127
-
128
-
129
-
130
-
131
-
132
-
133
-
134
-
135
-
136
-
137
-
138
-
139
-
140
-
141
-
142
-
143
-
144
-
145
-
146
-
147
-
148
-
149
-
150
-
151
-
152
-
153
-
154
-
155
-
156
-
157
-
158
-
159
-
160
-
161
-
162
-
163
-
164
-
165
-
166
-
167
-
168
-
169
-
170
-
171
-
172
-
173
-
174
-
175
-
176
-
177
-
178
-
179
-
180
-
181
-
182
-
183
-
184
 |
 |
2008 compared with 6.8% at December 31, 2007. We
issued $7.6 billion of preferred stock and a common
stock warrant to the US Department of the Treasury
under the TARP Capital Purchase Program on
December 31, 2008, which qualified as Tier 1 capital.
• Our tangible common equity ratio was 2.9% at
December 31, 2008. We expect our tangible common
equity ratio to be less sensitive to the impact of
widening credit spreads on accumulated other
comprehensive loss going forward primarily due to
the composition of the securities available for sale
portfolio acquired from National City and a
substantially higher level of tangible common equity
in the combined company.
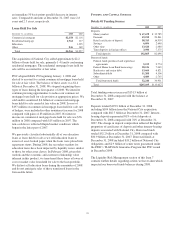
• We maintained a strong liquidity position and
continued to generate deposits. The loan to deposit
ratio was 91% at December 31, 2008, reflecting the
acquisition of National City. Average deposits for
2008 increased 10% compared with 2007.
• Credit quality migration reflected a rapidly
weakening economy, but remained manageable as
PNC was able to maintain a strong capital position
and generate positive operating leverage. The
allowance for loan and lease losses increased to $3.9
billion at December 31, 2008 from $830 million at
December 31, 2007 primarily as a result of the
National City acquisition and related conforming
credit adjustment. The ratio of allowance for loan and
lease losses to total loans was strengthened to 2.23%
at December 31, 2008 compared with 1.21% at
December 31, 2007. This ratio excluding the impact
of the National City acquisition was 1.77% at
December 31, 2008. We provide a reconciliation of
this ratio excluding the National City impact to the
GAAP-basis ratio in the Statistical Information
(Unaudited) section in Item 8 of this Report.
• Average loans for 2008 increased 16% over 2007.
• We are committed to supporting the objectives of the
Emergency Economic Stabilization Act of 2008. To
that end, we are continuing to make credit available
to qualified borrowers including enhanced calling
efforts on small businesses and corporations,
promotions offered with special financing rates and
responding to increased loan demand for first
mortgages. We have reaffirmed and renewed loans
and lines of credit, focused on early identification of
loan modification candidates and are working closely
where appropriate with customers who are
experiencing financial hardship to set up new
repayment schedules, loan modifications and
forbearance programs. We plan to enhance these
efforts over time to improve the effectiveness of our
broad-reaching initiatives.
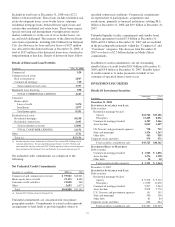
• Investment securities were $43.5 billion at
December 31, 2008, or 15% of total assets. The
portfolio was primarily comprised of well-
diversified, high quality securities with US
government agency residential mortgage-backed
securities representing 53% of the portfolio. Of the
remaining portfolio, approximately 80% of the
securities had AAA-equivalent ratings.
• PNC created positive operating leverage for the year
of 4%, or $351 million. Total revenue for 2008 grew
7% compared with 2007, driven by growth in net
interest income, and exceeded year-over-year
noninterest expense growth of 3%.
• With the acquisition of National City, our retail
banks now serve over 6 million consumer and
business customers. Comprehensive two-year
integration plans are being implemented with a goal
of eliminating $1.2 billion of annualized expenses,
including the reduction of approximately 5,800
positions across the combined 59,595 employee base
by 2011. The first regional branch conversion is
planned for the second half of 2009.
Our Consolidated Income Statement Review section of this
Item 7 describes in greater detail the various items that
impacted our results for 2008 and 2007.
B
ALANCE
S
HEET
H
IGHLIGHTS
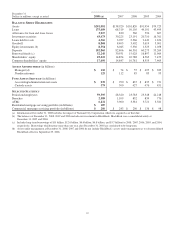
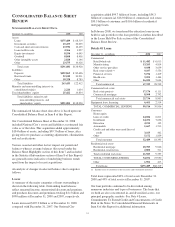
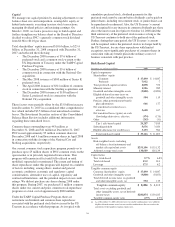
Total assets were $291.1 billion at December 31, 2008
compared with $138.9 billion at December 31, 2007. Total
assets at December 31, 2008 included $133.7 billion related to
National City. Our acquisition of National City did not impact
our 2008 Average Consolidated Balance Sheet.
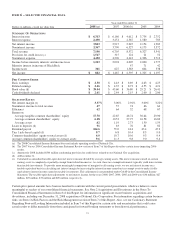
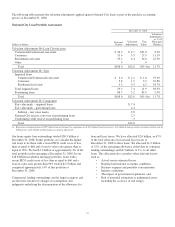
Total average assets were $142.0 billion for 2008 compared
with $123.4 billion for 2007. This increase reflected a $16.5
billion increase in average interest-earning assets and a $2.1
billion increase in average noninterest-earning assets. An
increase of $10.2 billion in loans and a $6.2 billion increase in
investment securities were the primary factors for the increase
in average interest-earning assets.
The increase in average noninterest-earning assets for 2008
reflected an increase in average goodwill of $1.6 billion
primarily related to the acquisition of Sterling on April 4,
2008, Yardville National Bancorp (“Yardville”) on
October 26, 2007 and Mercantile Bankshares Corporation
(“Mercantile”) on March 2, 2007.
The impact of the Sterling, Yardville and Mercantile
acquisitions is also reflected in our year-over-year increases in
average total loans, average securities available for sale and
average total deposits as described further below.
Average total loans were $72.7 billion for 2008 and $62.5
billion for 2007. The increase in average total loans included
growth in commercial loans of $5.5 billion, consumer loans of
$2.8 billion, commercial real estate loans of $1.7 billion and
residential mortgage loans of $.5 billion. Loans represented
64% of average interest-earning assets for both 2008 and
2007.
26