PNC Bank 2008 Annual Report Download - page 118
Download and view the complete annual report
Please find page 118 of the 2008 PNC Bank annual report below. You can navigate through the pages in the report by either clicking on the pages listed below, or by using the keyword search tool below to find specific information within the annual report.-
 1
1 -
2
-
3
-
4
-
5
-
6
-
7
-
8
-
9
-
10
-
11
-
12
-
13
-
14
-
15
-
16
-
17
-
18
-
19
-
20
-
21
-
22
-
23
-
24
-
25
-
26
-
27
-
28
-
29
-
30
-
31
-
32
-
33
-
34
-
35
-
36
-
37
-
38
-
39
-
40
-
41
-
42
-
43
-
44
-
45
-
46
-
47
-
48
-
49
-
50
-
51
-
52
-
53
-
54
-
55
-
56
-
57
-
58
-
59
-
60
-
61
-
62
-
63
-
64
-
65
-
66
-
67
-
68
-
69
-
70
-
71
-
72
-
73
-
74
-
75
-
76
-
77
-
78
-
79
-
80
-
81
-
82
-
83
-
84
-
85
-
86
-
87
-
88
-
89
-
90
-
91
-
92
-
93
-
94
-
95
-
96
-
97
-
98
-
99
-
100
-
101
-
102
-
103
-
104
-
105
-
106
-
107
-
 108
108 -
 109
109 -
 110
110 -
 111
111 -
 112
112 -
 113
113 -
 114
114 -
 115
115 -
 116
116 -
 117
117 -
 118
118 -
 119
119 -
 120
120 -
 121
121 -
 122
122 -
 123
123 -
 124
124 -
 125
125 -
 126
126 -
 127
127 -
 128
128 -
129
-
130
-
131
-
132
-
133
-
134
-
135
-
136
-
137
-
138
-
139
-
140
-
141
-
142
-
143
-
144
-
145
-
146
-
147
-
148
-
149
-
150
-
151
-
152
-
153
-
154
-
155
-
156
-
157
-
158
-
159
-
160
-
161
-
162
-
163
-
164
-
165
-
166
-
167
-
168
-
169
-
170
-
171
-
172
-
173
-
174
-
175
-
176
-
177
-
178
-
179
-
180
-
181
-
182
-
183
-
184
 |
 |

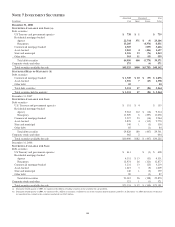
F
AIR
V
ALUE OF
F
INANCIAL
I
NSTRUMENTS
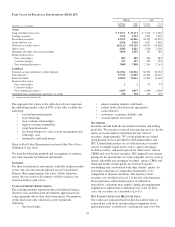
(SFAS 107)
2008 (a) 2007
December 31 – in millions
Carrying
Amount
Fair
Value
Carrying
Amount
Fair
Value
Assets
Cash and short-term assets $ 23,171 $ 23,171 $ 7,456 $ 7,456
Trading securities 1,725 1,725 3,556 3,556
Investment securities 43,473 43,406 30,225 30,225
Loans held for sale 4,366 4,366 3,927 3,966
Net loans (excludes leases) 165,112 162,159 64,976 65,808
Other assets 4,282 4,282 1,328 1,328
Mortgage and other loan servicing rights 1,890 1,899 701 780
Financial derivatives
Fair value hedges 889 889 283 283
Cash flow hedges 527 527 325 325
Free-standing derivatives 7,088 7,088 2,163 2,163
Liabilities
Demand, savings and money market deposits 116,946 116,946 56,294 56,294
Time deposits 75,919 76,205 26,402 26,416
Borrowed funds 52,872 53,063 31,254 31,608
Financial derivatives
Fair value hedges 1193 93
Cash flow hedges
Free-standing derivatives 6,057 6,057 2,298 2,298
Unfunded loan commitments and letters of credit 338 338 129 129
(a) Amounts include National City.
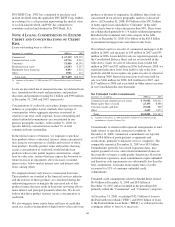
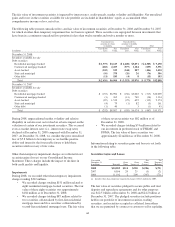
The aggregate fair values in the table above do not represent
the underlying market value of PNC as the table excludes the
following:
• real and personal property,
• lease financing,
• loan customer relationships,
• deposit customer intangibles,
• retail branch networks,
• fee-based businesses, such as asset management and
brokerage, and
• trademarks and brand names.
Refer to Fair Value Measurement section of this Note 8 for a
definition of fair value.
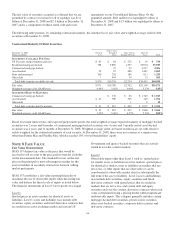
We used the following methods and assumptions to estimate
fair value amounts for financial instruments.
G
ENERAL
For short-term financial instruments realizable in three months
or less, the carrying amount reported in our Consolidated
Balance Sheet approximates fair value. Unless otherwise
stated, the rates used in discounted cash flow analyses are
based on market yield curves.
C
ASH AND
S
HORT
-T
ERM
A
SSETS
The carrying amounts reported in the consolidated balance
sheet for cash and short-term investments approximate fair
values primarily due to their short-term nature. For purposes
of this disclosure only, short-term assets include the
following:
• due from banks,
• interest-earning deposits with banks,
• federal funds sold and resale agreements,
• cash collateral,
• customers’ acceptance liability, and
• accrued interest receivable.
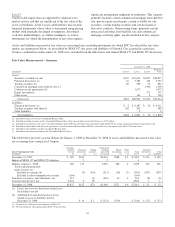
S
ECURITIES
Securities include both the investment securities and trading
portfolios. We use prices sourced from pricing services, dealer
quotes or recent trades to determine the fair value of
securities. Approximately 75% of our positions are valued
using pricing services provided by the Lehman Index and
IDC. Lehman Index prices are set with reference to market
activity for highly liquid assets such as agency mortgage-
backed securities, and matrix priced for other assets, such as
CMBS and asset-backed securities. IDC primarily uses matrix
pricing for the instruments we value using this service, such as
agency adjustable rate mortgage securities, agency CMOs and
municipal bonds. Dealer quotes received are typically
non-binding and corroborated with other dealers’ quotes, by
reviewing valuations of comparable instruments, or by
comparison to internal valuations. The majority of our
securities are classified as Level 2 in the fair value hierarchy.
In circumstances where market prices are limited or
unavailable, valuations may require significant management
judgments or adjustments to determine fair value. In these
cases, the securities are classified as Level 3.
N
ET
L
OANS AND
L
OANS
H
ELD FOR
S
ALE
Fair values are estimated based on the discounted value of
expected net cash flows incorporating assumptions about
prepayment rates, credit losses, servicing fees and costs. For
114