PNC Bank 2008 Annual Report Download - page 39
Download and view the complete annual report
Please find page 39 of the 2008 PNC Bank annual report below. You can navigate through the pages in the report by either clicking on the pages listed below, or by using the keyword search tool below to find specific information within the annual report.-
 1
1 -
2
-
3
-
4
-
5
-
6
-
7
-
8
-
9
-
10
-
11
-
12
-
13
-
14
-
15
-
16
-
17
-
18
-
19
-
20
-
21
-
22
-
23
-
24
-
25
-
26
-
27
-
28
-
 29
29 -
 30
30 -
 31
31 -
 32
32 -
 33
33 -
 34
34 -
 35
35 -
 36
36 -
 37
37 -
 38
38 -
 39
39 -
 40
40 -
 41
41 -
 42
42 -
 43
43 -
 44
44 -
 45
45 -
 46
46 -
 47
47 -
 48
48 -
 49
49 -
50
-
51
-
52
-
53
-
54
-
55
-
56
-
57
-
58
-
59
-
60
-
61
-
62
-
63
-
64
-
65
-
66
-
67
-
68
-
69
-
70
-
71
-
72
-
73
-
74
-
75
-
76
-
77
-
78
-
79
-
80
-
81
-
82
-
83
-
84
-
85
-
86
-
87
-
88
-
89
-
90
-
91
-
92
-
93
-
94
-
95
-
96
-
97
-
98
-
99
-
100
-
101
-
102
-
103
-
104
-
105
-
106
-
107
-
108
-
109
-
110
-
111
-
112
-
113
-
114
-
115
-
116
-
117
-
118
-
119
-
120
-
121
-
122
-
123
-
124
-
125
-
126
-
127
-
128
-
129
-
130
-
131
-
132
-
133
-
134
-
135
-
136
-
137
-
138
-
139
-
140
-
141
-
142
-
143
-
144
-
145
-
146
-
147
-
148
-
149
-
150
-
151
-
152
-
153
-
154
-
155
-
156
-
157
-
158
-
159
-
160
-
161
-
162
-
163
-
164
-
165
-
166
-
167
-
168
-
169
-
170
-
171
-
172
-
173
-
174
-
175
-
176
-
177
-
178
-
179
-
180
-
181
-
182
-
183
-
184
 |
 |

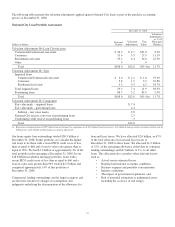
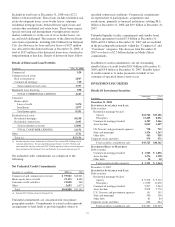
an immediate 50 basis points parallel decrease in interest
rates. Comparable amounts at December 31, 2007 were 2.8
years and 2.5 years, respectively.
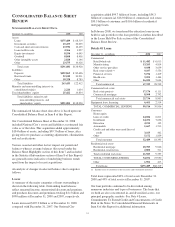
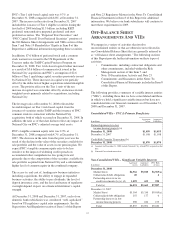
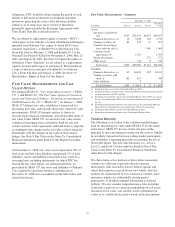
Loans Held For Sale
December 31 - in millions 2008 2007
Commercial mortgage $2,158 $2,116
Residential mortgage 1,962 117
Education 1,525
Other 246 169
Total $4,366 $3,927
The acquisition of National City added approximately $2.2
billion of loans held for sale, primarily 1-4 family conforming
residential mortgages. The residential mortgage loans held for
sale will be accounted for at fair value.
PNC adopted SFAS 159 beginning January 1, 2008 and
elected to account for certain commercial mortgage loans held
for sale at fair value. The balance of these assets was $1.4
billion at December 31, 2008. We stopped originating these
types of loans during the first quarter of 2008. We intend to
continue pursuing opportunities to reduce our commercial
mortgage loans held for sale position at appropriate prices. We
sold and/or securitized $.6 billion of commercial mortgage
loans held for sale carried at fair value in 2008. Losses of
$197 million on commercial mortgage loans held for sale, net
of hedges, were included in other noninterest income for 2008
compared with gains of $3 million in 2007. Net interest
income on commercial mortgage loans held for sale was $76
million in 2008 compared with $15 million in 2007. The
non-cash losses reflected illiquid market conditions which
began in the latter part of 2007.
We previously classified substantially all of our education
loans as loans held for sale as we sold education loans to
issuers of asset-backed paper when the loans were placed into
repayment status. During 2008, the secondary markets for
education loans have been impacted by liquidity issues similar
to those for other asset classes. In February 2008, given this
outlook and the economic and customer relationship value
inherent in this product, we transferred these loans at lower of
cost or market value from held for sale to the loan portfolio.
We did not sell education loans during the remainder of 2008
and do not anticipate sales of these transferred loans in the
foreseeable future.
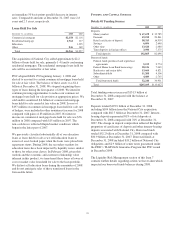
F
UNDING AND
C
APITAL
S
OURCES
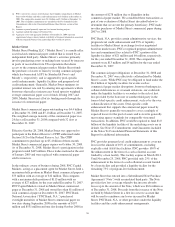
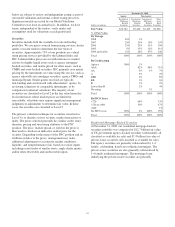
Details Of Funding Sources
December 31 - in millions 2008 2007
Deposits
Money market $ 67,678 $ 32,785
Demand 43,212 20,861
Retail certificates of deposit 58,315 16,939
Savings 6,056 2,648
Other time 13,620 2,088
Time deposits in foreign offices 3,984 7,375
Total deposits 192,865 82,696
Borrowed funds
Federal funds purchased and repurchase
agreements 5,153 9,774
Federal Home Loan Bank borrowings 18,126 7,065
Bank notes and senior debt 13,664 6,821
Subordinated debt 11,208 4,506
Other 4,089 2,765
Total borrowed funds 52,240 30,931
Total $245,105 $113,627
Total funding sources increased $131.5 billion at
December 31, 2008 compared with the balance at
December 31, 2007.
Deposits totaled $192.9 billion at December 31, 2008,
including $104 billion from the National City acquisition,
compared with $82.7 billion at December 31, 2007. Interest-
bearing deposits represented 81% of total deposits at
December 31, 2008 compared with 76% at December 31,
2007. The change in deposit composition reflected the higher
proportion of certificates of deposit and other interest-bearing
deposits associated with National City. Borrowed funds
totaled $52.2 billion at December 31, 2008 compared with
$30.9 billion at December 31, 2007. Borrowed funds at
December 31, 2008 included $18.2 billion of National City
obligations and $2.9 billion of senior notes guaranteed under
the FDIC’s TLGP-Debt Guarantee Program that PNC issued
in December 2008.
The Liquidity Risk Management section of this Item 7
contains further details regarding actions we have taken which
impacted our borrowed funds balances during 2008.
35