PNC Bank 2008 Annual Report Download - page 162
Download and view the complete annual report
Please find page 162 of the 2008 PNC Bank annual report below. You can navigate through the pages in the report by either clicking on the pages listed below, or by using the keyword search tool below to find specific information within the annual report.-
 1
1 -
2
-
3
-
4
-
5
-
6
-
7
-
8
-
9
-
10
-
11
-
12
-
13
-
14
-
15
-
16
-
17
-
18
-
19
-
20
-
21
-
22
-
23
-
24
-
25
-
26
-
27
-
28
-
29
-
30
-
31
-
32
-
33
-
34
-
35
-
36
-
37
-
38
-
39
-
40
-
41
-
42
-
43
-
44
-
45
-
46
-
47
-
48
-
49
-
50
-
51
-
52
-
53
-
54
-
55
-
56
-
57
-
58
-
59
-
60
-
61
-
62
-
63
-
64
-
65
-
66
-
67
-
68
-
69
-
70
-
71
-
72
-
73
-
74
-
75
-
76
-
77
-
78
-
79
-
80
-
81
-
82
-
83
-
84
-
85
-
86
-
87
-
88
-
89
-
90
-
91
-
92
-
93
-
94
-
95
-
96
-
97
-
98
-
99
-
100
-
101
-
102
-
103
-
104
-
105
-
106
-
107
-
108
-
109
-
110
-
111
-
112
-
113
-
114
-
115
-
116
-
117
-
118
-
119
-
120
-
121
-
122
-
123
-
124
-
125
-
126
-
127
-
128
-
129
-
130
-
131
-
132
-
133
-
134
-
135
-
136
-
137
-
138
-
139
-
140
-
141
-
142
-
143
-
144
-
145
-
146
-
147
-
148
-
149
-
150
-
151
-
 152
152 -
 153
153 -
 154
154 -
 155
155 -
 156
156 -
 157
157 -
 158
158 -
 159
159 -
 160
160 -
 161
161 -
 162
162 -
 163
163 -
 164
164 -
 165
165 -
 166
166 -
 167
167 -
 168
168 -
 169
169 -
 170
170 -
 171
171 -
 172
172 -
173
-
174
-
175
-
176
-
177
-
178
-
179
-
180
-
181
-
182
-
183
-
184
 |
 |

L
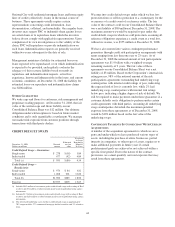
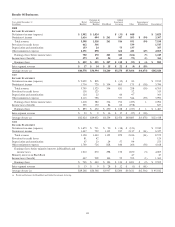
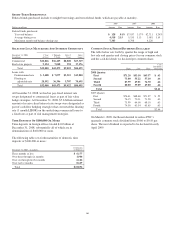
OANS
O
UTSTANDING
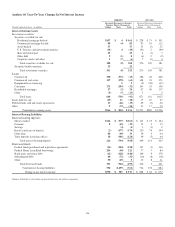
December 31 - in millions 2008 (a) 2007 2006 2005 2004
Commercial $ 67,319 $28,539 $20,508 $19,258 $17,438
Commercial real estate 25,736 8,903 3,527 3,157 1,980
Equipment lease financing 6,461 2,514 2,789 2,792 3,197
TOTAL COMMERCIAL LENDING 99,516 39,956 26,824 25,207 22,615
Consumer 52,489 18,393 16,569 16,246 15,604
Residential real estate 21,583 9,557 6,337 7,307 4,772
TOTAL CONSUMER LENDING 74,072 27,950 22,906 23,553 20,376
Other 1,901 413 375 341 504
Total loans $175,489 $68,319 $50,105 $49,101 $43,495
(a) Includes $99.7 billion of loans related to National City.
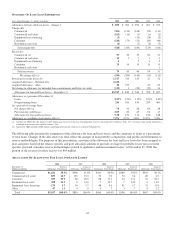
N
ONPERFORMING
A
SSETS AND
R
ELATED
I
NFORMATION
December 31 - dollars in millions 2008 (a) 2007 2006 2005 2004
Nonaccrual loans
Commercial $ 576 $193 $109 $ 134 $ 89
Commercial real estate 766 212 12 14 14
Equipment lease financing 97 3 1 17 5
Consumer 70 17 13 10 11
Residential real estate 153 27 25 24 28
Total nonaccrual loans $1,662 $452 $160 $ 199 $147
Troubled debt restructured loan 23
Total nonperforming loans 1,662 454 160 199 150
Foreclosed and other assets
Lease 11 12 13 14
Residential real estate 458 10 10 9 10
Other 45 20 2 3 5
Total foreclosed and other assets 503 41 24 25 29
Total nonperforming assets (b) (c) $2,165 $495 $184 $ 224 $179
Nonperforming loans to total loans .95% .66% .32% .41% .34%
Nonperforming assets to total loans and foreclosed assets 1.23 .72 .37 .46 .41
Nonperforming assets to total assets .74 .36 .18 .24 .22
Interest on nonperforming loans
Computed on original terms $ 115 $ 51 $ 15 $ 16 $ 11
Recognized prior to nonperforming status 60 32 4 5 2
Past due loans
Accruing loans past due 90 days or more $3,259 $136 $ 55 $ 53 $ 51
As a percentage of total loans 1.86% .20% .11% .11% .12%
Past due loans held for sale
Accruing loans held for sale past due 90 days or more $40 $8 $9 $47$9
As a percentage of total loans held for sale .92% .20% .38% 1.92% .54%
(a) Amounts at December 31, 2008 include $722 million of nonperforming assets related to National City.
(b) Excludes loans held for sale carried at lower of cost or market value of $78 million at December 31, 2008, $25 million at December 31, 2007, $1 million at December 31, 2005, and $3
million at December 31, 2004 (includes $5 million, $1 million and $2 million of troubled debt restructured loans held for sale at December 31, 2008, December 31, 2005 and 2004,
respectively).
(c) Excludes equity management assets that are carried at estimated fair value of $42 million at December 31, 2008, $4 million at December 31, 2007, $11 million (including $4 million
of troubled debt restructured assets) at December 31, 2006, $25 million (including $7 million of troubled debt restructured assets) at December 31, 2005, and $32 million (including
$11 million of troubled debt restructured assets) at December 31, 2004.
.
158