PNC Bank 2008 Annual Report Download - page 78
Download and view the complete annual report
Please find page 78 of the 2008 PNC Bank annual report below. You can navigate through the pages in the report by either clicking on the pages listed below, or by using the keyword search tool below to find specific information within the annual report.-
 1
1 -
2
-
3
-
4
-
5
-
6
-
7
-
8
-
9
-
10
-
11
-
12
-
13
-
14
-
15
-
16
-
17
-
18
-
19
-
20
-
21
-
22
-
23
-
24
-
25
-
26
-
27
-
28
-
29
-
30
-
31
-
32
-
33
-
34
-
35
-
36
-
37
-
38
-
39
-
40
-
41
-
42
-
43
-
44
-
45
-
46
-
47
-
48
-
49
-
50
-
51
-
52
-
53
-
54
-
55
-
56
-
57
-
58
-
59
-
60
-
61
-
62
-
63
-
64
-
65
-
66
-
67
-
 68
68 -
 69
69 -
 70
70 -
 71
71 -
 72
72 -
 73
73 -
 74
74 -
 75
75 -
 76
76 -
 77
77 -
 78
78 -
 79
79 -
 80
80 -
 81
81 -
 82
82 -
 83
83 -
 84
84 -
 85
85 -
 86
86 -
 87
87 -
 88
88 -
89
-
90
-
91
-
92
-
93
-
94
-
95
-
96
-
97
-
98
-
99
-
100
-
101
-
102
-
103
-
104
-
105
-
106
-
107
-
108
-
109
-
110
-
111
-
112
-
113
-
114
-
115
-
116
-
117
-
118
-
119
-
120
-
121
-
122
-
123
-
124
-
125
-
126
-
127
-
128
-
129
-
130
-
131
-
132
-
133
-
134
-
135
-
136
-
137
-
138
-
139
-
140
-
141
-
142
-
143
-
144
-
145
-
146
-
147
-
148
-
149
-
150
-
151
-
152
-
153
-
154
-
155
-
156
-
157
-
158
-
159
-
160
-
161
-
162
-
163
-
164
-
165
-
166
-
167
-
168
-
169
-
170
-
171
-
172
-
173
-
174
-
175
-
176
-
177
-
178
-
179
-
180
-
181
-
182
-
183
-
184
 |
 |

Loans held for sale also included education loans held for sale
of $1.5 billion at December 31, 2007 and $1.3 billion at
December 31, 2006. Gains on sales of education loans totaled
$24 million in 2007 and $33 million for 2006. These gains are
reflected in the other noninterest income line item in our
Consolidated Income Statement and in the results of the Retail
Banking business segment.
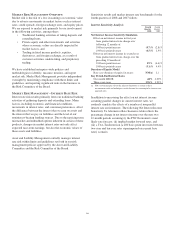
Asset Quality
Total nonperforming assets at December 31, 2007 increased
$311 million, to $495 million, compared with December 31,
2006. Nonperforming loans, the largest component of
nonperforming assets, increased $294 million, to $454
million, at December 31, 2007 compared with December 31,
2006. Of this increase in nonperforming loans, $192 million
occurred during the fourth quarter of 2007. The increase was
primarily due to higher nonaccrual commercial real estate
loans primarily related to residential real estate development
exposure. At December 31, 2007, our largest nonperforming
asset was approximately $20 million and our average
nonperforming loan associated with commercial lending was
approximately $0.5 million.
The ratio of nonperforming assets to total assets rose to .36%
at December 31, 2007 compared with .18% at December 31,
2006. The allowance for loan and lease losses was $830
million and represented 1.21% of total loans and 183% of
nonperforming loans at December 31, 2007. The comparable
amounts were $560 million, 1.12% and 350%, respectively, at
December 31, 2006.
Goodwill and Other Intangible Assets
The sum of goodwill and other intangible assets increased
$5.5 billion at December 31, 2007 compared with the prior
year end, to $9.6 billion. We added $4.7 billion of goodwill
and other intangible assets in connection with the Mercantile
acquisition. In addition, our acquisitions of ARCS, Yardville
and Albridge collectively added $.9 billion of goodwill and
other intangible assets during 2007.
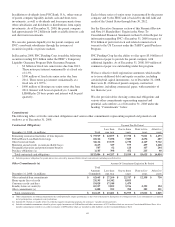
Funding Sources
Total funding sources were $113.6 billion at December 31,
2007 and $81.3 billion at December 31, 2006. Funding
sources increased $32.3 billion in the comparison as total
deposits increased $16.4 billion and total borrowed funds
increased $15.9 billion. Our acquisition of Mercantile added
$12.5 billion of deposits and $2.1 billion of borrowed funds.
The Yardville acquisition resulted in $2.0 billion of deposits.
During the first quarter of 2007 we issued borrowings to fund
the $2.1 billion cash portion of the Mercantile acquisition. The
remaining increase in borrowed funds was the result of growth
in loans and securities and the need to fund other net changes
in our balance sheet. During the second half of 2007 we
substantially increased Federal Home Loan Bank borrowings,
which provided us with additional liquidity at relatively
attractive rates.
Shareholders’ Equity
Total shareholders’ equity increased $4.1 billion, to $14.9
billion, at December 31, 2007 compared with December 31,
2006. In addition to the net impact of earnings and dividends
in 2007, this increase reflected a $2.5 billion reduction in
treasury stock and a $1.0 billion increase in capital surplus,
largely due to the issuance of PNC common shares for the
Mercantile and Yardville acquisitions.
Regulatory capital ratios at December 31, 2007 were 6.2% for
leverage, 6.8% for Tier 1 risk-based and 10.3% for total risk-
based capital. At December 31, 2006, the regulatory capital
ratios were 9.3% for leverage, 10.4% for Tier 1 risk-based and
13.5% for total risk-based capital.
Glossary of Terms
Accounting/administration net fund assets - Net domestic and
foreign fund investment assets for which we provide
accounting and administration services. We do not include
these assets on our Consolidated Balance Sheet.
Adjusted average total assets - Primarily comprised of total
average quarterly (or annual) assets plus (less) unrealized
losses (gains) on investment securities, less goodwill and
certain other intangible assets (net of eligible deferred taxes).
Annualized - Adjusted to reflect a full year of activity.
Assets under management - Assets over which we have sole or
shared investment authority for our customers/clients. We do
not include these assets on our Consolidated Balance Sheet.
Basis point - One hundredth of a percentage point.
Charge-off - Process of removing a loan or portion of a loan
from our balance sheet because it is considered uncollectible.
We also record a charge-off when a loan is transferred to held
for sale by reducing the carrying amount by the allowance for
loan losses associated with such loan or, if the market value is
less than its carrying amount, by the amount of that difference.
Common shareholders’ equity to total assets - Common
shareholders’ equity divided by total assets. Common
shareholders’ equity equals total shareholders’ equity less the
liquidation value of preferred stock.
Credit derivatives - Contractual agreements, primarily credit
default swaps, that provide protection against a credit event of
one or more referenced credits. The nature of a credit event is
established by the protection buyer and protection seller at the
inception of a transaction, and such events include
bankruptcy, insolvency and failure to meet payment
obligations when due. The buyer of the credit derivative pays
a periodic fee in return for a payment by the protection seller
upon the occurrence, if any, of a credit event.
74