PNC Bank 2008 Annual Report Download - page 34
Download and view the complete annual report
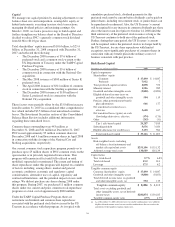
Please find page 34 of the 2008 PNC Bank annual report below. You can navigate through the pages in the report by either clicking on the pages listed below, or by using the keyword search tool below to find specific information within the annual report.Commercial mortgage banking activities resulted in revenue
of $65 million in 2008 compared with $252 million in 2007.
Revenue for 2008 reflected losses of $197 million on
commercial mortgage loans held for sale, net of hedges, due to
the impact of an illiquid market during most of 2008. The
comparable amount for 2007 was a gain of $3 million.
Revenue for 2007 also reflected significant securitization
activity. In addition, commercial mortgage servicing revenue
declined $53 million primarily due to a $35 million
impairment charge on commercial mortgage servicing rights
while net interest income from commercial mortgage loans
held for sale increased $61 million in 2008 compared with
2007 due to higher loans held for sale balances.
P
ROVISION
F
OR
C
REDIT
L
OSSES
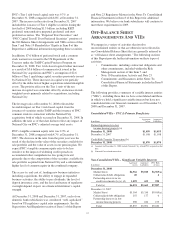
The provision for credit losses totaled $1.517 billion for 2008
compared with $315 million for 2007. Of the total 2008
provision, $990 million was recorded in the fourth quarter,
including $504 million of additional provision recorded on
December 31, 2008 to conform the National City loan
reserving methodology with ours. The differences in
methodology include granularity of loss computations,
statistical and quantitative factors rather than qualitative
assessment, and the extent of current appraisals and risk
assessments.
In addition to the impact of National City, the higher provision
in 2008 compared with the prior year was driven by general
credit quality migration, including residential real estate
development and commercial real estate exposure, an increase
in net charge-offs, and growth in nonperforming loans.
Growth in our total credit exposure also contributed to the
higher provision amounts in both comparisons.
With a deteriorating economy, we expect credit migration will
continue throughout 2009 as credit quality improvements will
lag any economic turnaround. The Credit Risk Management
portion of the Risk Management section of this Item 7
includes additional information regarding factors impacting
the provision for credit losses.
See also Item 1A Risk Factors and the Cautionary Statement
Regarding Forward-Looking Information section of Item 7 of
this Report.
N
ONINTEREST
E
XPENSE
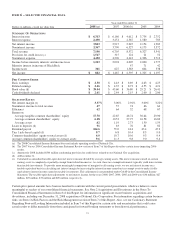
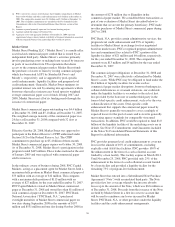
Total noninterest expense was $4.430 billion for 2008 and
$4.296 billion for 2007, an increase of $134 million, or 3%.
Higher noninterest expense in 2008 compared with 2007
primarily resulted from investments in growth initiatives,
including acquisitions, partially offset by the impact of the
sale of Hilliard Lyons and disciplined expense management.
Integration costs included in noninterest expense totaled $122
million for 2008, including $81 million in the fourth quarter,
and $102 million for 2007. Integration costs for the fourth
quarter of 2008 included $71 million related to our National
City acquisition.
Noninterest expense for 2008 included the benefit of the
reversal of $46 million of the $82 million Visa
indemnification liability that we established in the fourth
quarter of 2007. Additional information regarding our
transactions related to Visa is included in Note 25
Commitments And Guarantees in the Notes To Consolidated
Financial Statements included in Item 8 of this Report.
Expense management will be a key driver in 2009 as we
intend to maintain our focus on continuous improvement and
to achieve cost savings targets associated with our National
City integration. We currently expect FDIC deposit insurance
costs to increase significantly in 2009.
E
FFECTIVE
T
AX
R
ATE
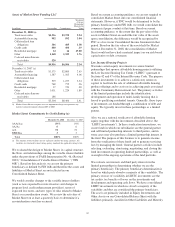
Our effective tax rate was 29.1% for 2008 and 29.9% for
2007.
30


