PNC Bank 2008 Annual Report Download - page 47
Download and view the complete annual report
Please find page 47 of the 2008 PNC Bank annual report below. You can navigate through the pages in the report by either clicking on the pages listed below, or by using the keyword search tool below to find specific information within the annual report.-
 1
1 -
2
-
3
-
4
-
5
-
6
-
7
-
8
-
9
-
10
-
11
-
12
-
13
-
14
-
15
-
16
-
17
-
18
-
19
-
20
-
21
-
22
-
23
-
24
-
25
-
26
-
27
-
28
-
29
-
30
-
31
-
32
-
33
-
34
-
35
-
36
-
 37
37 -
 38
38 -
 39
39 -
 40
40 -
 41
41 -
 42
42 -
 43
43 -
 44
44 -
 45
45 -
 46
46 -
 47
47 -
 48
48 -
 49
49 -
 50
50 -
 51
51 -
 52
52 -
 53
53 -
 54
54 -
 55
55 -
 56
56 -
 57
57 -
58
-
59
-
60
-
61
-
62
-
63
-
64
-
65
-
66
-
67
-
68
-
69
-
70
-
71
-
72
-
73
-
74
-
75
-
76
-
77
-
78
-
79
-
80
-
81
-
82
-
83
-
84
-
85
-
86
-
87
-
88
-
89
-
90
-
91
-
92
-
93
-
94
-
95
-
96
-
97
-
98
-
99
-
100
-
101
-
102
-
103
-
104
-
105
-
106
-
107
-
108
-
109
-
110
-
111
-
112
-
113
-
114
-
115
-
116
-
117
-
118
-
119
-
120
-
121
-
122
-
123
-
124
-
125
-
126
-
127
-
128
-
129
-
130
-
131
-
132
-
133
-
134
-
135
-
136
-
137
-
138
-
139
-
140
-
141
-
142
-
143
-
144
-
145
-
146
-
147
-
148
-
149
-
150
-
151
-
152
-
153
-
154
-
155
-
156
-
157
-
158
-
159
-
160
-
161
-
162
-
163
-
164
-
165
-
166
-
167
-
168
-
169
-
170
-
171
-
172
-
173
-
174
-
175
-
176
-
177
-
178
-
179
-
180
-
181
-
182
-
183
-
184
 |
 |

below are subject to review and independent testing as part of
our model validation and internal control testing processes.
Significant models are tested by our Model Validation
Committee on at least an annual basis. In addition, we have
teams, independent of the traders, verify marks and
assumptions used for valuations at each period end.
Securities
Securities include both the available for sale and trading
portfolios. We use prices sourced from pricing services, dealer
quotes or recent trades to determine the fair value of
securities. Approximately 75% of our positions are valued
using pricing services provided by the Lehman Index and
IDC. Lehman Index prices are set with reference to market
activity for highly liquid assets such as agency mortgage-
backed securities, and matrix priced for other assets, such as
CMBS and asset-backed securities. IDC primarily uses matrix
pricing for the instruments we value using this service, such as
agency adjustable rate mortgage securities, agency CMOs and
municipal bonds. Dealer quotes received are typically
non-binding and corroborated with other dealers’ quotes, by
reviewing valuations of comparable instruments, or by
comparison to internal valuations. The majority of our
securities are classified as Level 2 in the fair value hierarchy.
In circumstances where market prices are limited or
unavailable, valuations may require significant management
judgments or adjustments to determine fair value. In these
cases, the securities are classified as Level 3.
The primary valuation technique for securities classified as
Level 3 is to identify a proxy security, market transaction or
index. The proxy selected generally has similar credit, tenor,
duration, pricing and structuring attributes to the PNC
position. The price, market spread, or yield on the proxy is
then used to calculate an indicative market price for the
security. Depending on the nature of the PNC position and its
attributes relative to the proxy, management may make
additional adjustments to account for market conditions,
liquidity, and nonperformance risk, based on various inputs
including recent trades of similar assets, single dealer quotes,
and/or other observable and unobservable inputs.
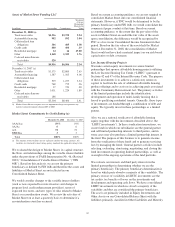
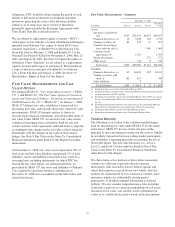
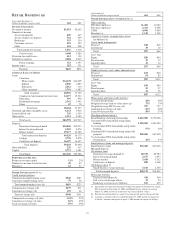
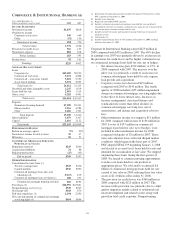
December 31, 2008
Agency Non-Agency
Dollars in millions
Residential
Mortgage-
Backed
Securities
Residential
Mortgage-
Backed
Securities
Commercial
Mortgage-
Backed
Securities
Other
Asset-
Back
Securities
Fair Value $12,742 $7,420 $3,419 $1,492
% of Fair Value:
By Vintage
2008 36% 1%
2007 24% 15% 10% 15%
2006 23% 23% 31% 30%
2005 5% 35% 12% 31%
2004 and earlier 12% 26% 47% 24%
Total 100% 100% 100% 100%
By Credit rating
Agency 100% 1%
AAA 82% 98% 71%
AA 4% 1% 7%
A5%2%
BBB 2% 8%
BB 3% 6%
B1%2%
Lower than B 2% 4%
No rating 1%
Total 100% 100% 100% 100%
By FICO Score
>720 68% 13%
<720 or >660 30% 47%
<660 1%
No FICO score 100% 2% 100% 39%
Total 100% 100% 100% 100%
Residential Mortgage-Backed Securities
At December 31, 2008, our residential mortgage-backed
securities portfolio was comprised of $12.7 billion fair value
of US government agency-backed securities (substantially all
classified as available for sale) and $7.4 billion fair value of
private-issuer securities (all classified as available for sale).
The agency securities are generally collateralized by 1-4
family, conforming, fixed-rate residential mortgages.The
private-issuer securities are also generally collateralized by
1-4 family residential mortgages. The mortgage loans
underlying the private-issuer securities are generally
43