PNC Bank 2008 Annual Report Download - page 132
Download and view the complete annual report
Please find page 132 of the 2008 PNC Bank annual report below. You can navigate through the pages in the report by either clicking on the pages listed below, or by using the keyword search tool below to find specific information within the annual report.-
 1
1 -
2
-
3
-
4
-
5
-
6
-
7
-
8
-
9
-
10
-
11
-
12
-
13
-
14
-
15
-
16
-
17
-
18
-
19
-
20
-
21
-
22
-
23
-
24
-
25
-
26
-
27
-
28
-
29
-
30
-
31
-
32
-
33
-
34
-
35
-
36
-
37
-
38
-
39
-
40
-
41
-
42
-
43
-
44
-
45
-
46
-
47
-
48
-
49
-
50
-
51
-
52
-
53
-
54
-
55
-
56
-
57
-
58
-
59
-
60
-
61
-
62
-
63
-
64
-
65
-
66
-
67
-
68
-
69
-
70
-
71
-
72
-
73
-
74
-
75
-
76
-
77
-
78
-
79
-
80
-
81
-
82
-
83
-
84
-
85
-
86
-
87
-
88
-
89
-
90
-
91
-
92
-
93
-
94
-
95
-
96
-
97
-
98
-
99
-
100
-
101
-
102
-
103
-
104
-
105
-
106
-
107
-
108
-
109
-
110
-
111
-
112
-
113
-
114
-
115
-
116
-
117
-
118
-
119
-
120
-
121
-
 122
122 -
 123
123 -
 124
124 -
 125
125 -
 126
126 -
 127
127 -
 128
128 -
 129
129 -
 130
130 -
 131
131 -
 132
132 -
 133
133 -
 134
134 -
 135
135 -
 136
136 -
 137
137 -
 138
138 -
 139
139 -
 140
140 -
 141
141 -
 142
142 -
143
-
144
-
145
-
146
-
147
-
148
-
149
-
150
-
151
-
152
-
153
-
154
-
155
-
156
-
157
-
158
-
159
-
160
-
161
-
162
-
163
-
164
-
165
-
166
-
167
-
168
-
169
-
170
-
171
-
172
-
173
-
174
-
175
-
176
-
177
-
178
-
179
-
180
-
181
-
182
-
183
-
184
 |
 |

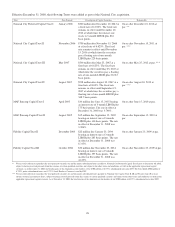
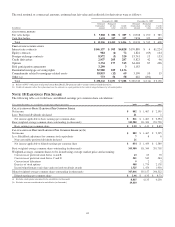
The asset allocation for National City’s defined benefit
pension plan as of the measurement date, by asset category is
as follows:
Percentage of Plan Assets
National City Pension Plan December 31 2008
Asset Category
Equity securities 42%
Fixed income securities 9%
Cash and cash equivalents 49%
Total 100%
The investment objective for the National City qualified
pension plan is to maximize total return with tolerance for
slightly above average risk. Asset allocation strongly favors
equities, with a target allocation of approximately 80% equity
securities, 15% fixed income securities, and 5% cash. Due to
volatility in the market, the target allocation is not always
desirable as asset allocations will fluctuate. A core equity
position of large cap stocks will be maintained. However,
more aggressive or volatile sectors will be meaningfully
represented in the asset mix in pursuit of higher returns.
Higher volatility investment strategies such as credit risk,
structured finance, and international bonds will be appropriate
strategies in conjunction with the core position. As of
December 31, 2008, the plan had a temporary large cash and
cash equivalents balance due to a contribution of $850 million
made by National City to the plan on December 30, 2008
which had not yet been fully invested.
Equity securities included $9 million of National City
common stock at December 31, 2008, representing
5,048,833 shares at a closing price of $1.81. In conjunction
with PNC’s acquisition of National City, these shares were
exchanged into 197,914 shares of PNC common stock.
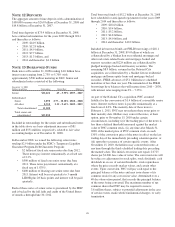
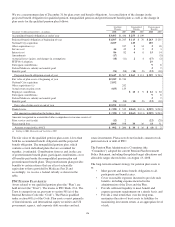
The following table provides information regarding our
estimated future cash flows related to our various plans,
including the impact of the National City plans:
E
STIMATED
C
ASH
F
LOWS
Postretirement Benefits
In millions
Qualified
Pension
Nonqualified
Pension
Gross
PNC
Benefit
Payments
Reduction
in PNC
Benefit
Payments
Due to
Medicare
Part D
Subsidy
Estimated 2009
employer
contributions — $ 29 $ 35 $2
Estimated future
benefit
payments
2009 $ 247 $ 29 $ 35 $2
2010 253 30 36 2
2011 262 28 34 2
2012 267 28 34 2
2013 277 25 34 2
2014 – 2018 1,499 109 164 9
The qualified pension plan contributions are deposited into the
Trust, and the qualified pension plan benefit payments are
paid from the Trust. For the other plans, total contributions
and the benefit payments are the same and represent expected
benefit amounts, which are paid from general assets.
Postretirement benefits are net of participant contributions.
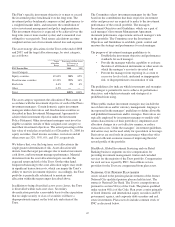
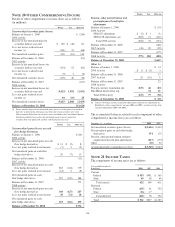
The components of net periodic benefit cost/ (income) and other amounts recognized in other comprehensive income were as
follows. This table excludes the impact of the National City plans which we acquired on December 31, 2008.
Qualified Pension Plan Nonqualified Pension Plan Postretirement Benefits
Year ended December 31 – in millions 2008 2007 2006 2008 2007 2006 2008 2007 2006
Net periodic cost consists of:
Service cost $44 $42 $34 $2 $2 $1 $3 $3 $2
Interest cost 86 82 68 664 15 14 13
Expected return on plan assets (160) (156) (129)
Amortization of prior service cost (2) (1) (7) (7) (6)
Amortization of actuarial losses 2 16 223 1
Net periodic cost $ (32) $ (30) $ (12) $10 $10 $8 $11 $10 $10
Other changes in plan assets and benefit obligations recognized in other
comprehensive income:
Current year prior service cost/(credit) $ (17) $ (5)
Amortization of prior service (cost)/credit 2$77
Current year actuarial loss/(gain) 807 $16 $2 $4 (17) (2)
Amortization of actuarial (loss)/gain (2) (2) (2)
Total recognized in OCI 792 14 2 (10)
Total recognized in net periodic cost and OCI $ 760 $ (16) $10 $12 $1 $10
128