PNC Bank 2008 Annual Report Download - page 24
Download and view the complete annual report
Please find page 24 of the 2008 PNC Bank annual report below. You can navigate through the pages in the report by either clicking on the pages listed below, or by using the keyword search tool below to find specific information within the annual report.-
 1
1 -
2
-
3
-
4
-
5
-
6
-
7
-
8
-
9
-
10
-
11
-
12
-
13
-
 14
14 -
 15
15 -
 16
16 -
 17
17 -
 18
18 -
 19
19 -
 20
20 -
 21
21 -
 22
22 -
 23
23 -
 24
24 -
 25
25 -
 26
26 -
 27
27 -
 28
28 -
 29
29 -
 30
30 -
 31
31 -
 32
32 -
 33
33 -
 34
34 -
35
-
36
-
37
-
38
-
39
-
40
-
41
-
42
-
43
-
44
-
45
-
46
-
47
-
48
-
49
-
50
-
51
-
52
-
53
-
54
-
55
-
56
-
57
-
58
-
59
-
60
-
61
-
62
-
63
-
64
-
65
-
66
-
67
-
68
-
69
-
70
-
71
-
72
-
73
-
74
-
75
-
76
-
77
-
78
-
79
-
80
-
81
-
82
-
83
-
84
-
85
-
86
-
87
-
88
-
89
-
90
-
91
-
92
-
93
-
94
-
95
-
96
-
97
-
98
-
99
-
100
-
101
-
102
-
103
-
104
-
105
-
106
-
107
-
108
-
109
-
110
-
111
-
112
-
113
-
114
-
115
-
116
-
117
-
118
-
119
-
120
-
121
-
122
-
123
-
124
-
125
-
126
-
127
-
128
-
129
-
130
-
131
-
132
-
133
-
134
-
135
-
136
-
137
-
138
-
139
-
140
-
141
-
142
-
143
-
144
-
145
-
146
-
147
-
148
-
149
-
150
-
151
-
152
-
153
-
154
-
155
-
156
-
157
-
158
-
159
-
160
-
161
-
162
-
163
-
164
-
165
-
166
-
167
-
168
-
169
-
170
-
171
-
172
-
173
-
174
-
175
-
176
-
177
-
178
-
179
-
180
-
181
-
182
-
183
-
184
 |
 |
required, unless the preferred stock is no longer held by the US Treasury, for any
share repurchases with limited exceptions, most significantly purchases of common
shares in connection with any benefit plan in the ordinary course of business
consistent with past practice.
(b) Reflects PNC common stock purchased in connection with our various employee
benefit plans. No shares were purchased under the program referred to in note (c) to
this table during the fourth quarter of 2008.
(c) Our current stock repurchase program allows us to purchase up to 25 million shares
on the open market or in privately negotiated transactions. This program was
authorized on October 4, 2007 and will remain in effect until fully utilized or until
modified, superseded or terminated.
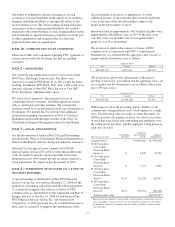
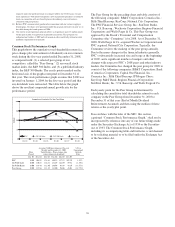
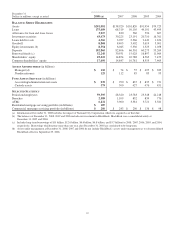
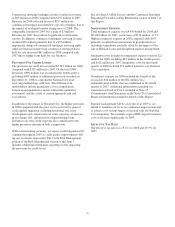
Common Stock Performance Graph
This graph shows the cumulative total shareholder return (i.e.,
price change plus reinvestment of dividends) on our common
stock during the five-year period ended December 31, 2008,
as compared with: (1) a selected peer group of our
competitors, called the “Peer Group;” (2) an overall stock
market index, the S&P 500 Index; and (3) a published industry
index, the S&P 500 Banks. The yearly points marked on the
horizontal axis of the graph correspond to December 31 of
that year. The stock performance graph assumes that $100 was
invested on January 1, 2004 for the five-year period and that
any dividends were reinvested. The table below the graph
shows the resultant compound annual growth rate for the
performance period.
Comparison of Cumulative Five Year Total Return
0
50
100
150
200
Dec 03 Dec 04 Dec 05 Dec 06 Dec 07 Dec 08
Dollars
PNC S&P 500 Index S&P 500 Banks Peer Group
Base
Period
Assumes $100 investment at Close of
Market on December 31, 2002
Total Return = Price change plus
reinvestment of dividends
5-Year
Compound
Growth
Rate
Dec 03 Dec 04 Dec 05 Dec 06 Dec 07 Dec 08
PNC $100 108.92 121.63 150.33 137.87 107.29 1.42%
S&P 500 Index $100 110.88 116.32 134.69 142.09 89.52 (2.19)%
S&P 500 Banks $100 114.44 112.80 130.99 91.98 48.29 (13.55)%
Peer Group $100 112.86 113.85 133.00 94.06 45.03 (14.75)%
The Peer Group for the preceding chart and table consists of
the following companies: BB&T Corporation; Comerica Inc.;
Fifth Third Bancorp; KeyCorp; National City Corporation;
The PNC Financial Services Group, Inc.; SunTrust Banks,
Inc.; U.S. Bancorp.; Wachovia Corporation; Regions Financial
Corporation; and Wells Fargo & Co. This Peer Group was
approved by the Board’s Personnel and Compensation
Committee (the “Committee”) for 2008. As of December 31,
2008, Wells Fargo & Co. acquired Wachovia Corporation and
PNC acquired National City Corporation. Typically, the
Committee reviews the makeup of the peer group annually.
Due to the many changes in the financial industry generally,
PNC’s substantially increased size and scope at the beginning
of 2009, and a significant number of mergers and other
changes with respect to PNC’s 2008 peers and other industry
leaders, the Committee has changed the peer group for 2009 to
consist of the following companies: BB&T Corporation; Bank
of America Corporation; Capital One Financial, Inc.;
Comerica Inc.; Fifth Third Bancorp; JPMorgan Chase;
KeyCorp; M&T Bank; Regions Financial Corporation;
SunTrust Banks, Inc.; U.S. Bancorp; and Wells Fargo & Co.
Each yearly point for the Peer Group is determined by
calculating the cumulative total shareholder return for each
company in the Peer Group from December 31, 2003 to
December 31 of that year (End of Month Dividend
Reinvestment Assumed) and then using the median of these
returns as the yearly plot point.
In accordance with the rules of the SEC, this section,
captioned “Common Stock Performance Graph,” shall not be
incorporated by reference into any of our future filings made
under the Securities Exchange Act of 1934 or the Securities
Act of 1933. The Common Stock Performance Graph,
including its accompanying table and footnotes, is not deemed
to be soliciting material or to be filed under the Exchange Act
or the Securities Act.
20