PNC Bank 2008 Annual Report Download - page 116
Download and view the complete annual report
Please find page 116 of the 2008 PNC Bank annual report below. You can navigate through the pages in the report by either clicking on the pages listed below, or by using the keyword search tool below to find specific information within the annual report.-
 1
1 -
2
-
3
-
4
-
5
-
6
-
7
-
8
-
9
-
10
-
11
-
12
-
13
-
14
-
15
-
16
-
17
-
18
-
19
-
20
-
21
-
22
-
23
-
24
-
25
-
26
-
27
-
28
-
29
-
30
-
31
-
32
-
33
-
34
-
35
-
36
-
37
-
38
-
39
-
40
-
41
-
42
-
43
-
44
-
45
-
46
-
47
-
48
-
49
-
50
-
51
-
52
-
53
-
54
-
55
-
56
-
57
-
58
-
59
-
60
-
61
-
62
-
63
-
64
-
65
-
66
-
67
-
68
-
69
-
70
-
71
-
72
-
73
-
74
-
75
-
76
-
77
-
78
-
79
-
80
-
81
-
82
-
83
-
84
-
85
-
86
-
87
-
88
-
89
-
90
-
91
-
92
-
93
-
94
-
95
-
96
-
97
-
98
-
99
-
100
-
101
-
102
-
103
-
104
-
105
-
 106
106 -
 107
107 -
 108
108 -
 109
109 -
 110
110 -
 111
111 -
 112
112 -
 113
113 -
 114
114 -
 115
115 -
 116
116 -
 117
117 -
 118
118 -
 119
119 -
 120
120 -
 121
121 -
 122
122 -
 123
123 -
 124
124 -
 125
125 -
 126
126 -
127
-
128
-
129
-
130
-
131
-
132
-
133
-
134
-
135
-
136
-
137
-
138
-
139
-
140
-
141
-
142
-
143
-
144
-
145
-
146
-
147
-
148
-
149
-
150
-
151
-
152
-
153
-
154
-
155
-
156
-
157
-
158
-
159
-
160
-
161
-
162
-
163
-
164
-
165
-
166
-
167
-
168
-
169
-
170
-
171
-
172
-
173
-
174
-
175
-
176
-
177
-
178
-
179
-
180
-
181
-
182
-
183
-
184
 |
 |

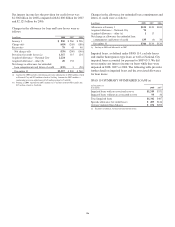
The after-tax adjustment to beginning retained earnings from
the adoption of SFAS 157 and SFAS 159 related to Level 3
fair value measurements was approximately $1 million each.
Net gains (realized and unrealized) relating to Level 3 assets
and liabilities were $1 million for 2008. This amount included
net unrealized losses of $209 million. These amounts were
included in other noninterest income in the Consolidated
Income Statement.
During 2008, securities transferred into Level 3 from Level 2
exceeded securities transferred out by $4.3 billion. These
primarily related to private issuer asset-backed securities,
auction rate securities, residential mortgage-backed securities
and corporate bonds and occurred due to reduced volume of
recently executed transactions and the lack of corroborating
market price quotations for these instruments. Other Level 3
assets include commercial mortgage loans held for sale,
private equity investments and other assets.
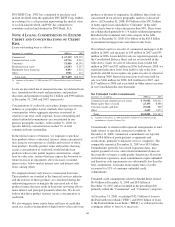
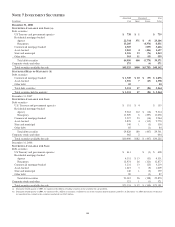
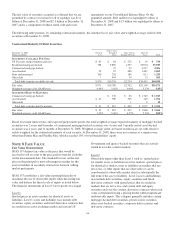
Nonrecurring Fair Value Changes
We may be required to measure certain other financial assets
at fair value on a nonrecurring basis. These adjustments to fair
value usually result from the application of
lower-of-cost-or-market accounting or write-downs of
individual assets due to impairment. The amounts below for
nonaccrual loans and loans held for sale represent the carrying
value of loans for which adjustments are primarily based on
the appraised value of collateral or the present value of
expected future cash flows, which often results in significant
management assumptions and input with respect to the
determination of fair value. The fair value determination of
the equity investment resulting in an impairment loss included
below was based on observable market data for other
comparable entities as adjusted for internal assumptions and
unobservable inputs. The amounts below for commercial
mortgage servicing rights reflect an impairment of certain
strata of these assets. The fair value of commercial mortgage
servicing rights is estimated by using an internal valuation
model. The model calculates the present value of estimated
future net servicing cash flows considering estimates on
servicing revenue and costs, discount rates and prepayment
speeds. Annually, this model is subject to an internal review
process to validate controls and model results.
Fair Value Measurements – Nonrecurring
In millions
December 31,
2008
Total Fair
Value (a)
Total
losses for
year ended
December 31,
2008
Assets
Nonaccrual loans $250 $ (99)
Loans held for sale 101 (2)
Equity investment 75 (73)
Commercial mortgage servicing
rights 560 (35)
Total assets $986 $(209)
(a) All Level 3.
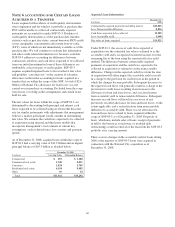
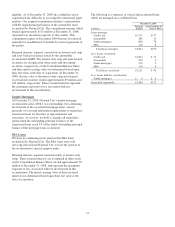
Fair Value Option
Commercial Mortgage Loans Held For Sale
Effective January 1, 2008, we elected to account for
commercial mortgage loans classified as held for sale and
intended for securitization at fair value under the provisions of
SFAS 159. Based on the significance of unobservable inputs,
we classify this portfolio as Level 3. As such, a synthetic
securitization methodology was used historically to value the
loans and the related unfunded commitments on an aggregate
basis based upon current commercial mortgage-backed
securities (CMBS) market structures and conditions. The
election of the fair value option aligns the accounting for the
commercial mortgages with the related hedges. It also
eliminates the requirements of hedge accounting under SFAS
133. Due to the inactivity in the CMBS securitization market
in 2008, we determined the fair value of commercial mortgage
loans held for sale by using a whole loan valuation
methodology. Based on the significance of unobservable
inputs, we classified this portfolio as Level 3. Valuation
assumptions included observable inputs based on whole loan
sales, both observed in the market and actual sales from our
portfolio and new loan origination spreads during the quarter.
Adjustments were made to the assumptions to account for
uncertainties, including market conditions, and liquidity.
Credit risk was included as part of our valuation process for
these loans by considering expected rates of return for market
participants for similar loans in the marketplace.
PNC has not elected the fair value option for the remainder of
our loans held for sale portfolio as the amounts are not
significant and hedge accounting is not used for these loans.
At December 31, 2008, commercial mortgage loans held for
sale for which the fair value option had been elected had an
aggregate fair value of $1.4 billion and an aggregate
outstanding principal balance of $1.6 billion.
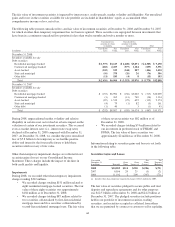
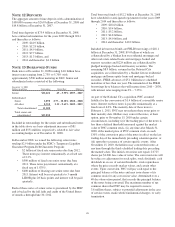
Interest income on these loans is recorded as earned and
reported in the Consolidated Income Statement in the caption
Interest Income – Other. Net losses resulting from changes in
fair value of these loans of $251 million for 2008 were
recorded in other noninterest income. The impact on earnings
of offsetting hedges is not reflected in these amounts. Changes
in fair value due to instrument-specific credit risk for 2008
were not material. The changes in fair value of these loans
were partially offset by changes in the fair value of the related
financial derivatives that economically hedged these loans.
Customer Resale Agreements and Bank Notes
Effective January 1, 2008, we elected to account for structured
resale agreements and structured bank notes at fair value,
which are economically hedged using free-standing financial
derivatives.
The fair value for structured resale agreements and structured
bank notes is determined using a model which includes
observable market data as inputs such as interest rates.
112