PNC Bank 2008 Annual Report Download - page 36
Download and view the complete annual report
Please find page 36 of the 2008 PNC Bank annual report below. You can navigate through the pages in the report by either clicking on the pages listed below, or by using the keyword search tool below to find specific information within the annual report.-
 1
1 -
2
-
3
-
4
-
5
-
6
-
7
-
8
-
9
-
10
-
11
-
12
-
13
-
14
-
15
-
16
-
17
-
18
-
19
-
20
-
21
-
22
-
23
-
24
-
25
-
 26
26 -
 27
27 -
 28
28 -
 29
29 -
 30
30 -
 31
31 -
 32
32 -
 33
33 -
 34
34 -
 35
35 -
 36
36 -
 37
37 -
 38
38 -
 39
39 -
 40
40 -
 41
41 -
 42
42 -
 43
43 -
 44
44 -
 45
45 -
 46
46 -
47
-
48
-
49
-
50
-
51
-
52
-
53
-
54
-
55
-
56
-
57
-
58
-
59
-
60
-
61
-
62
-
63
-
64
-
65
-
66
-
67
-
68
-
69
-
70
-
71
-
72
-
73
-
74
-
75
-
76
-
77
-
78
-
79
-
80
-
81
-
82
-
83
-
84
-
85
-
86
-
87
-
88
-
89
-
90
-
91
-
92
-
93
-
94
-
95
-
96
-
97
-
98
-
99
-
100
-
101
-
102
-
103
-
104
-
105
-
106
-
107
-
108
-
109
-
110
-
111
-
112
-
113
-
114
-
115
-
116
-
117
-
118
-
119
-
120
-
121
-
122
-
123
-
124
-
125
-
126
-
127
-
128
-
129
-
130
-
131
-
132
-
133
-
134
-
135
-
136
-
137
-
138
-
139
-
140
-
141
-
142
-
143
-
144
-
145
-
146
-
147
-
148
-
149
-
150
-
151
-
152
-
153
-
154
-
155
-
156
-
157
-
158
-
159
-
160
-
161
-
162
-
163
-
164
-
165
-
166
-
167
-
168
-
169
-
170
-
171
-
172
-
173
-
174
-
175
-
176
-
177
-
178
-
179
-
180
-
181
-
182
-
183
-
184
 |
 |

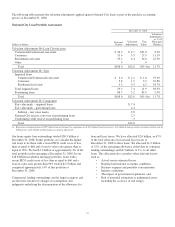
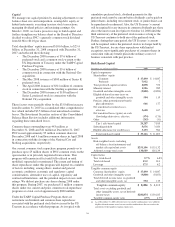
The following table presents the valuation adjustments applied against National City loans as part of the purchase accounting
process at December 31, 2008.
National City Loan Portfolio Assessment
Dollars in billions
December 31, 2008
Principal
Balance
Valuation
Adjustment
Fair
Value
Valuation
Adjustment
as%of
Principal
Balance
Valuation Adjustments By Loan Classification
Commercial/Commercial real estate $ 56.5 $ 4.7 $51.8 8.3%
Consumer 31.4 3.5 27.9 11.1%
Residential real estate 19.2 4.4 14.8 22.9%
Other .9 .9
Total $108.0 $12.6 $95.4(a) 11.7%
Valuation Adjustments By Type
Impaired loans
Commercial/Commercial real estate $ 4.0 $ 2.2 $ 1.8 55.0%
Consumer 5.8 1.9 3.9 32.8%
Residential real estate 9.5 3.3 6.2 34.7%
Total impaired loans 19.3 7.4 11.9 38.3%
Performing loans 88.7 5.2 83.5 5.9%
Total $108.0 $12.6 $95.4(a) 11.7%
Valuation Adjustments By Component
Fair value mark – impaired loans $ 7.4
Fair value mark – performing loans 2.4
Subtotal – fair value marks 9.8
National City reserve carryover on performing loans 2.3
Conforming credit reserve on performing loans .5
Total $12.6
(a) Represents total adjusted loans of $99.7 billion from the National City acquisition, net of $2.8 billion of loan loss reserves, $1.1 billion of loans previously classified as held for sale by
National City, and $.4 billion of other purchase accounting adjustments.
Our home equity loan outstandings totaled $38.3 billion at
December 31, 2008. In this portfolio, we consider the higher
risk loans to be those with a recent FICO credit score of less
than or equal to 660 and a loan-to-value ratio greater than or
equal to 90%. We had $1.2 billion or approximately 3% of the
total portfolio in this grouping at December 31, 2008. In our
$18.8 billion residential mortgage portfolio, loans with a
recent FICO credit score of less than or equal to 660 and a
loan-to-value ratio greater than 90% totaled $2.5 billion and
comprised approximately 14% of this portfolio at
December 31, 2008.
Commercial lending outstandings are the largest category and
are the most sensitive to changes in assumptions and
judgments underlying the determination of the allowance for
loan and lease losses. We have allocated $2.6 billion, or 67%,
of the total allowance for loan and lease losses at
December 31, 2008 to these loans. We allocated $1.2 billion,
or 32%, of the remaining allowance at that date to consumer
lending outstandings and $47 million, or 1%, to all other
loans. This allocation also considers other relevant factors
such as:
• Actual versus estimated losses,
• Regional and national economic conditions,
• Business segment and portfolio concentrations,
• Industry conditions,
• The impact of government regulations, and
• Risk of potential estimation or judgmental errors,
including the accuracy of risk ratings.
32