PNC Bank 2008 Annual Report Download - page 139
Download and view the complete annual report
Please find page 139 of the 2008 PNC Bank annual report below. You can navigate through the pages in the report by either clicking on the pages listed below, or by using the keyword search tool below to find specific information within the annual report.-
 1
1 -
2
-
3
-
4
-
5
-
6
-
7
-
8
-
9
-
10
-
11
-
12
-
13
-
14
-
15
-
16
-
17
-
18
-
19
-
20
-
21
-
22
-
23
-
24
-
25
-
26
-
27
-
28
-
29
-
30
-
31
-
32
-
33
-
34
-
35
-
36
-
37
-
38
-
39
-
40
-
41
-
42
-
43
-
44
-
45
-
46
-
47
-
48
-
49
-
50
-
51
-
52
-
53
-
54
-
55
-
56
-
57
-
58
-
59
-
60
-
61
-
62
-
63
-
64
-
65
-
66
-
67
-
68
-
69
-
70
-
71
-
72
-
73
-
74
-
75
-
76
-
77
-
78
-
79
-
80
-
81
-
82
-
83
-
84
-
85
-
86
-
87
-
88
-
89
-
90
-
91
-
92
-
93
-
94
-
95
-
96
-
97
-
98
-
99
-
100
-
101
-
102
-
103
-
104
-
105
-
106
-
107
-
108
-
109
-
110
-
111
-
112
-
113
-
114
-
115
-
116
-
117
-
118
-
119
-
120
-
121
-
122
-
123
-
124
-
125
-
126
-
127
-
128
-
 129
129 -
 130
130 -
 131
131 -
 132
132 -
 133
133 -
 134
134 -
 135
135 -
 136
136 -
 137
137 -
 138
138 -
 139
139 -
 140
140 -
 141
141 -
 142
142 -
 143
143 -
 144
144 -
 145
145 -
 146
146 -
 147
147 -
 148
148 -
 149
149 -
150
-
151
-
152
-
153
-
154
-
155
-
156
-
157
-
158
-
159
-
160
-
161
-
162
-
163
-
164
-
165
-
166
-
167
-
168
-
169
-
170
-
171
-
172
-
173
-
174
-
175
-
176
-
177
-
178
-
179
-
180
-
181
-
182
-
183
-
184
 |
 |

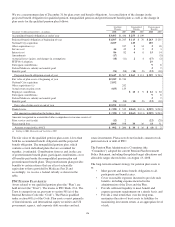
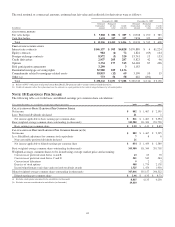
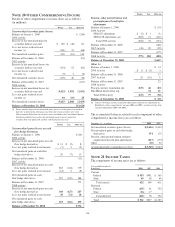
The total notional or contractual amounts, estimated net fair value and credit risk for derivatives were as follows:
December 31, 2008 December 31, 2007
In millions
Notional/
Contractual
amount
Estimated
net fair
value
Credit
risk (b)
Notional/
Contractual
amount
Estimated
net fair
value
Credit
risk (b)
A
CCOUNTING HEDGES
Fair value hedges $ 9,888 $ 888 $ 889 $ 10,568 $ 190 $ 283
Cash flow hedges 5,618 527 527 7,856 325 325
Total $ 15,506 $1,415 $ 1,416 $ 18,424 $ 515 $ 608
F
REE
-
STANDING DERIVATIVES
Interest rate contracts $146,137 $ 503 $4,828 $170,889 $ 4 $1,224
Equity contracts 984 (4) 72 1,824 (69) 144
Foreign exchange contracts 8,972 (3) 320 15,741 13 153
Credit derivatives 2,937 205 287 5,823 42 96
Options 3,334 177 315 64,448 87 496
Risk participation agreements 3,290 3 1,183
Residential mortgage servicing rights 52,980 109 1,136
Commitments related to mortgage-related assets 18,853 (12) 69 3,190 10 15
Other (a) 773 56 58 642 (201)
Total $ 238,260 $1,031 $ 7,088 $ 263,740 $ (114) $ 2,128
(a) Relates to PNC’s obligation to help fund certain BlackRock LTIP programs and to certain customer-related derivatives.
(b) Credit risk amounts reflect the replacement cost for contracts in a gain position in the event of nonperformance by all counterparties.
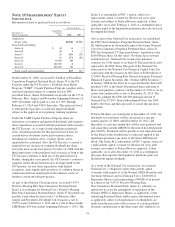
N
OTE
18 E
ARNINGS
P
ER
S
HARE
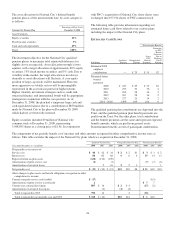
The following table sets forth basic and diluted earnings per common share calculations:
Year ended December 31 - in millions, except share and per share data 2008 2007 2006
C
ALCULATION OF
B
ASIC
E
ARNINGS
P
ER
C
OMMON
S
HARE
Net income $ 882 $ 1,467 $ 2,595
Less: Preferred dividends declared 21 1
Net income applicable to basic earnings per common share $ 861 $ 1,467 $ 2,594
Basic weighted-average common shares outstanding (in thousands) 343,980 331,300 291,758
Basic earnings per common share $ 2.50 $ 4.43 $ 8.89
C
ALCULATION OF
D
ILUTED
E
ARNINGS
P
ER
C
OMMON
S
HARE
(a) (b)
Net income $ 882 $ 1,467 $ 2,595
Less: BlackRock adjustment for common stock equivalents 786
Non-convertible preferred dividends declared 21
Net income applicable to diluted earnings per common share $ 854 $ 1,459 $ 2,589
Basic weighted-average common shares outstanding (in thousands) 343,980 331,300 291,758
Weighted-average common shares to be issued using average market price and assuming:
Conversion of preferred stock Series A and B 63 65 70
Conversion of preferred stock Series C and D 501 542 584
Conversion of debentures 922
Exercise of stock options 988 1,774 2,178
Incentive/performance unit share and restricted stock/unit awards 1,525 1,474 1,930
Diluted weighted-average common shares outstanding (in thousands) 347,066 335,157 296,522
Diluted earnings per common share $ 2.46 $ 4.35 $ 8.73
(a) Excludes stock options considered to be anti-dilutive (in thousands) 8,815 4,135 4,230
(b) Excludes warrants considered to be anti-dilutive (in thousands) 19,410
135