PNC Bank 2008 Annual Report Download - page 115
Download and view the complete annual report
Please find page 115 of the 2008 PNC Bank annual report below. You can navigate through the pages in the report by either clicking on the pages listed below, or by using the keyword search tool below to find specific information within the annual report.-
 1
1 -
2
-
3
-
4
-
5
-
6
-
7
-
8
-
9
-
10
-
11
-
12
-
13
-
14
-
15
-
16
-
17
-
18
-
19
-
20
-
21
-
22
-
23
-
24
-
25
-
26
-
27
-
28
-
29
-
30
-
31
-
32
-
33
-
34
-
35
-
36
-
37
-
38
-
39
-
40
-
41
-
42
-
43
-
44
-
45
-
46
-
47
-
48
-
49
-
50
-
51
-
52
-
53
-
54
-
55
-
56
-
57
-
58
-
59
-
60
-
61
-
62
-
63
-
64
-
65
-
66
-
67
-
68
-
69
-
70
-
71
-
72
-
73
-
74
-
75
-
76
-
77
-
78
-
79
-
80
-
81
-
82
-
83
-
84
-
85
-
86
-
87
-
88
-
89
-
90
-
91
-
92
-
93
-
94
-
95
-
96
-
97
-
98
-
99
-
100
-
101
-
102
-
103
-
104
-
 105
105 -
 106
106 -
 107
107 -
 108
108 -
 109
109 -
 110
110 -
 111
111 -
 112
112 -
 113
113 -
 114
114 -
 115
115 -
 116
116 -
 117
117 -
 118
118 -
 119
119 -
 120
120 -
 121
121 -
 122
122 -
 123
123 -
 124
124 -
 125
125 -
126
-
127
-
128
-
129
-
130
-
131
-
132
-
133
-
134
-
135
-
136
-
137
-
138
-
139
-
140
-
141
-
142
-
143
-
144
-
145
-
146
-
147
-
148
-
149
-
150
-
151
-
152
-
153
-
154
-
155
-
156
-
157
-
158
-
159
-
160
-
161
-
162
-
163
-
164
-
165
-
166
-
167
-
168
-
169
-
170
-
171
-
172
-
173
-
174
-
175
-
176
-
177
-
178
-
179
-
180
-
181
-
182
-
183
-
184
 |
 |

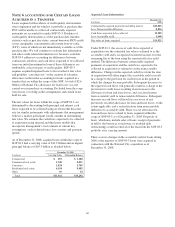
Level 3
Unobservable inputs that are supported by minimal or no
market activity and that are significant to the fair value of the
assets or liabilities. Level 3 assets and liabilities may include
financial instruments whose value is determined using pricing
models with internally developed assumptions, discounted
cash flow methodologies, or similar techniques, as well as
instruments for which the determination of fair value requires
significant management judgment or estimation. This category
generally includes certain commercial mortgage loans held for
sale, private equity investments, certain available for sale
securities, certain trading securities and certain financial
derivative contracts. Nonrecurring items, primarily certain
nonaccrual and other loans held for sale and commercial
mortgage servicing rights, are also included in this category.
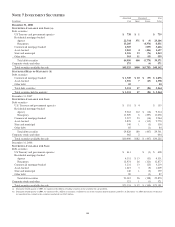
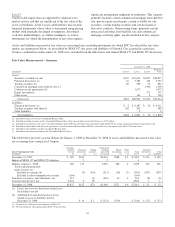
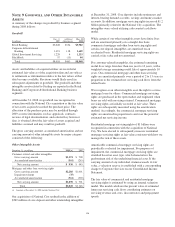
Assets and liabilities measured at fair value on a recurring basis, including instruments for which PNC has elected the fair value
option, are summarized below. As prescribed by SFAS 157, the assets and liabilities of National City acquired in a purchase
business combination on December 31, 2008 were excluded from the table below and related SFAS 157 and SFAS 159 disclosures.
Fair Value Measurements – Summary
December 31, 2008
In millions Level 1 Level 2 Level 3
Total Fair
Value
Assets
Securities available for sale $347 $21,633 $4,837 $26,817
Financial derivatives (a) 16 5,582 125 5,723
Trading securities (b) 89 529 73 691
Commercial mortgage loans held for sale (c) 1,400 1,400
Customer resale agreements (d) 1,072 1,072
Equity investments 571 571
Other assets 144 6 150
Total assets $452 $28,960 $7,012 $36,424
Liabilities
Financial derivatives (e) $ 2 $ 4,387 $ 22 $ 4,411
Trading securities sold short (f) 182 207 389
Other liabilities 99
Total liabilities $184 $ 4,603 $ 22 $ 4,809
(a) Included in other assets on the Consolidated Balance Sheet.
(b) Included in trading securities on the Consolidated Balance Sheet. Fair value includes net unrealized losses of $27.5 million.
(c) Included in loans held for sale on the Consolidated Balance Sheet. PNC has elected the fair value option under SFAS 159 for certain commercial mortgage loans held for sale.
(d) Included in federal funds sold and resale agreements on the Consolidated Balance Sheet. PNC has elected the fair value option under SFAS 159 for this item.
(e) Included in other liabilities on the Consolidated Balance Sheet.
(f) Included in other borrowed funds on the Consolidated Balance Sheet.
The table below presents a reconciliation for January 1, 2008 to December 31, 2008 of assets and liabilities measured at fair value
on a recurring basis using Level 3 inputs.
Level 3 Instruments Only
In millions
Securities
available
for sale
(c)
Financial
derivatives
(c)
Trading
securities
(c)
Commercial
mortgage
loans held
for sale (d)
Equity
investments
(c)
Other
assets
(c)
Total
Assets
Financial
derivatives
(c)
Total
Liabilities
December 31, 2007 $ 285 $130 $2,018 $568 $ 4 $3,005 $ 326 $ 326
Impact of SFAS 157 and SFAS 159 adoption 2 2 4
Balance, January 1, 2008 285 132 2,020 568 4 3,009 326 326
Total realized/unrealized
gains or losses (a):
Included in earnings (b) (9) $ (4) (251) (30) (2) (296) (297) (297)
Included in other comprehensive income (164) (164)
Purchases, issuances, and settlements, net 515 18 (369) 33 4 201 (8) (8)
Transfers into Level 3, net 4,201 2 59 4,262 1 1
December 31, 2008 $4,837 $125 $73 $1,400 $571 $ 6 $7,012 $ 22 $ 22
(a) Losses for assets are bracketed which losses
for liabilities are not.
(b) Attributable to unrealized gains or losses
related to assets or liabilities held at
December 31, 2008: $ 16 $ 1 $ (213) $ (50) $ (246) $ (37) $ (37)
(c) Carried at fair value prior to our adoption of SFAS 157.
(d) We elected the fair value option under SFAS 159 for this item.
111