PNC Bank 2008 Annual Report Download - page 31
Download and view the complete annual report
Please find page 31 of the 2008 PNC Bank annual report below. You can navigate through the pages in the report by either clicking on the pages listed below, or by using the keyword search tool below to find specific information within the annual report.-
 1
1 -
2
-
3
-
4
-
5
-
6
-
7
-
8
-
9
-
10
-
11
-
12
-
13
-
14
-
15
-
16
-
17
-
18
-
19
-
20
-
 21
21 -
 22
22 -
 23
23 -
 24
24 -
 25
25 -
 26
26 -
 27
27 -
 28
28 -
 29
29 -
 30
30 -
 31
31 -
 32
32 -
 33
33 -
 34
34 -
 35
35 -
 36
36 -
 37
37 -
 38
38 -
 39
39 -
 40
40 -
 41
41 -
42
-
43
-
44
-
45
-
46
-
47
-
48
-
49
-
50
-
51
-
52
-
53
-
54
-
55
-
56
-
57
-
58
-
59
-
60
-
61
-
62
-
63
-
64
-
65
-
66
-
67
-
68
-
69
-
70
-
71
-
72
-
73
-
74
-
75
-
76
-
77
-
78
-
79
-
80
-
81
-
82
-
83
-
84
-
85
-
86
-
87
-
88
-
89
-
90
-
91
-
92
-
93
-
94
-
95
-
96
-
97
-
98
-
99
-
100
-
101
-
102
-
103
-
104
-
105
-
106
-
107
-
108
-
109
-
110
-
111
-
112
-
113
-
114
-
115
-
116
-
117
-
118
-
119
-
120
-
121
-
122
-
123
-
124
-
125
-
126
-
127
-
128
-
129
-
130
-
131
-
132
-
133
-
134
-
135
-
136
-
137
-
138
-
139
-
140
-
141
-
142
-
143
-
144
-
145
-
146
-
147
-
148
-
149
-
150
-
151
-
152
-
153
-
154
-
155
-
156
-
157
-
158
-
159
-
160
-
161
-
162
-
163
-
164
-
165
-
166
-
167
-
168
-
169
-
170
-
171
-
172
-
173
-
174
-
175
-
176
-
177
-
178
-
179
-
180
-
181
-
182
-
183
-
184
 |
 |

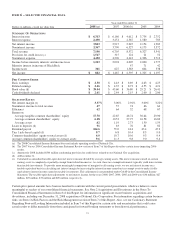
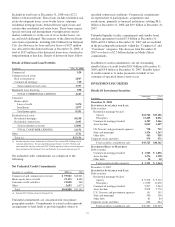
Average investment securities totaled $32.7 billion for 2008
and $26.5 billion for 2007. Average residential and
commercial mortgage-backed securities increased $4.5 billion
on a combined basis in the comparison. Average investment
securities for 2008 included $.4 billion of held to maturity
securities that we transferred from available for sale status
during the fourth quarter of 2008. Investment securities
comprised 29% of average interest-earning assets for 2008
and 27% for 2007.
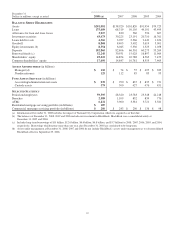
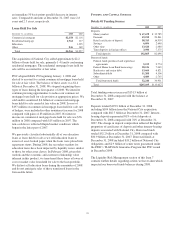
Average total deposits were $84.5 billion for 2008, an increase
of $7.7 billion over 2007. Average deposits grew from the
prior year period primarily as a result of increases in money
market balances and other time deposits.
Average total deposits represented 60% of average total assets
for 2008 and 62% for 2007. Average transaction deposits were
$55.7 billion for 2008 compared with $50.7 billion for 2007.
Average borrowed funds were $31.3 billion for 2008 and
$23.0 billion for 2007. Increases of $7.1 billion in Federal
Home Loan Bank borrowings and $1.4 billion in other
borrowed funds drove the increase compared with 2007.
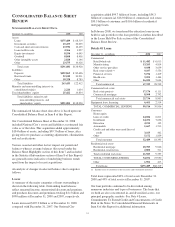
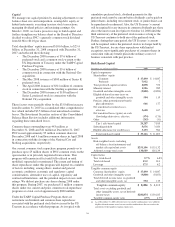
Shareholders’ equity totaled $25.4 billion at December 31,
2008 compared with $14.9 billion at December 31, 2007 and
reflected the issuance of securities under the TARP Capital
Purchase Program and the impact of National City. See the
Consolidated Balance Sheet Review section of this Item 7 for
additional information.
L
INE OF
B
USINESS
H
IGHLIGHTS
We refer you to Item 1 of this Report under the captions
Business Overview and Review of Lines of Business for an
overview of our business segments and to the Business
Segments Review section of this Item 7 for a Results Of
Businesses – Summary table and further analysis of business
segment results for 2008 and 2007, including presentation
differences from Note 27 Segment Reporting in the Notes To
Consolidated Financial Statements in Item 8 of this Report.
Total business segment earnings were $983 million for 2008
and $1.7 billion for 2007. We provide a reconciliation of total
business segment earnings to total PNC consolidated net
income as reported on a GAAP basis in Note 27.
Retail Banking
Retail Banking’s earnings were $429 million for 2008
compared with $876 million for 2007. The decline in earnings
over the prior year was primarily driven by increases in the
provision for credit losses and noninterest expense. The 2008
revenue growth was negatively impacted by a lower interest
credit attributed to deposits in the declining rate environment
and was therefore not reflective of the solid growth in
customers and deposits.
Corporate & Institutional Banking
Corporate & Institutional Banking earned $225 million in
2008 compared with $432 million in 2007. The 48% decline
in earnings over 2007 was primarily driven by an increase in
the provision for credit losses and by higher valuation losses
on commercial mortgage loans held for sale, net of hedges.
BlackRock
Our BlackRock business segment earned $207 million in 2008
and $253 million in 2007. These results reflect our
approximately 33% share of BlackRock’s reported GAAP
earnings during both periods and the additional income taxes
on these earnings incurred by PNC.
Global Investment Servicing
Global Investment Servicing earned $122 million for 2008
and $128 million for 2007. Results for 2008 were negatively
impacted by declines in asset values and fund redemptions as
a result of severe deterioration of the financial markets during
the fourth quarter.
Other
“Other” incurred a loss of $101 million in 2008 and a loss of
$222 million in 2007.
“Other” for 2008 included the impact of integration costs,
including the National City conforming provision for credit
losses, totaling $422 million after taxes, of which $380 million
after taxes were recognized in the fourth quarter of 2008. In
addition, net securities losses in 2008 totaled $134 million
after taxes. These factors were partially offset by strong
growth in net interest income related to asset and liability
management activities in 2008, and the after-tax impact of the
following:
• After-tax gains totaling $160 million from PNC’s
remaining BlackRock long-term incentive plan
programs (“LTIP”) shares obligation,
• The $23 million after-tax gain on the sale of Hilliard
Lyons in the first quarter,
• The $40 million after-tax third quarter reversal of a
legal contingency reserve established in connection
with an acquisition due to a settlement, and
• The $30 million after-tax partial reversal of the Visa
indemnification liability.
“Other” for 2007 included the after-tax impact of the
following:
• Integration costs totaling $99 million after taxes,
• A net after-tax charge of $83 million representing the
net mark-to-market adjustment on our remaining
BlackRock LTIP shares obligation partially offset by
the gain recognized in connection with PNC’s first
quarter transfer of BlackRock shares to satisfy a
portion of our BlackRock LTIP shares obligation,
and
• A $53 million after-tax charge for an indemnification
obligation related to certain Visa litigation.
27