PNC Bank 2008 Annual Report Download - page 58
Download and view the complete annual report
Please find page 58 of the 2008 PNC Bank annual report below. You can navigate through the pages in the report by either clicking on the pages listed below, or by using the keyword search tool below to find specific information within the annual report.-
 1
1 -
2
-
3
-
4
-
5
-
6
-
7
-
8
-
9
-
10
-
11
-
12
-
13
-
14
-
15
-
16
-
17
-
18
-
19
-
20
-
21
-
22
-
23
-
24
-
25
-
26
-
27
-
28
-
29
-
30
-
31
-
32
-
33
-
34
-
35
-
36
-
37
-
38
-
39
-
40
-
41
-
42
-
43
-
44
-
45
-
46
-
47
-
 48
48 -
 49
49 -
 50
50 -
 51
51 -
 52
52 -
 53
53 -
 54
54 -
 55
55 -
 56
56 -
 57
57 -
 58
58 -
 59
59 -
 60
60 -
 61
61 -
 62
62 -
 63
63 -
 64
64 -
 65
65 -
 66
66 -
 67
67 -
 68
68 -
69
-
70
-
71
-
72
-
73
-
74
-
75
-
76
-
77
-
78
-
79
-
80
-
81
-
82
-
83
-
84
-
85
-
86
-
87
-
88
-
89
-
90
-
91
-
92
-
93
-
94
-
95
-
96
-
97
-
98
-
99
-
100
-
101
-
102
-
103
-
104
-
105
-
106
-
107
-
108
-
109
-
110
-
111
-
112
-
113
-
114
-
115
-
116
-
117
-
118
-
119
-
120
-
121
-
122
-
123
-
124
-
125
-
126
-
127
-
128
-
129
-
130
-
131
-
132
-
133
-
134
-
135
-
136
-
137
-
138
-
139
-
140
-
141
-
142
-
143
-
144
-
145
-
146
-
147
-
148
-
149
-
150
-
151
-
152
-
153
-
154
-
155
-
156
-
157
-
158
-
159
-
160
-
161
-
162
-
163
-
164
-
165
-
166
-
167
-
168
-
169
-
170
-
171
-
172
-
173
-
174
-
175
-
176
-
177
-
178
-
179
-
180
-
181
-
182
-
183
-
184
 |
 |

G
LOBAL
I
NVESTMENT
S
ERVICING
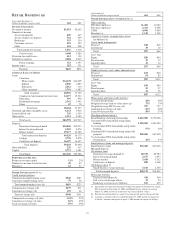
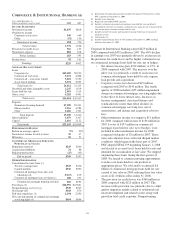
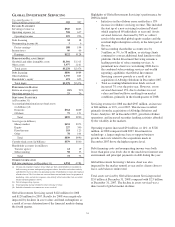
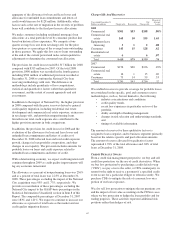
Year ended December 31
Dollars in millions except as noted 2008 2007
I
NCOME
S
TATEMENT
Servicing revenue (a) $947 $863
Operating expense (a) 728 637
Operating income 219 226
Debt financing 34 38
Nonoperating income (b) 36
Pretax earnings 188 194
Income taxes 66 66
Earnings $122 $128
P
ERIOD
-
END
B
ALANCE
S
HEET
Goodwill and other intangible assets $1,301 $1,315
Other assets 3,977 1,161
Total assets $5,278 $2,476
Debt financing $850 $989
Other liabilities 3,737 865
Shareholder’s equity 691 622
Total funds $5,278 $2,476
P
ERFORMANCE
R
ATIOS
Return on average equity 18% 23%
Operating margin (c) 23 26
S
ERVICING
S
TATISTICS
(at December 31)
Accounting/administration net fund assets
(in billions) (d)
Domestic $764 $869
Offshore 75 121
Total $839 $990
Asset type (in billions)
Money market $431 $373
Equity 227 390
Fixed income 103 123
Other 78 104
Total $839 $990
Custody fund assets (in billions) $379 $500
Shareholder accounts (in millions)
Transfer agency 14 19
Subaccounting 58 53
Total 72 72
O
THER INFORMATION
Full-time employees (at December 31) 4,934 4,784
(a) Certain out-of-pocket expense items which are then client billable are included in
both servicing revenue and operating expense above, but offset each other entirely
and therefore have no effect on operating income. Distribution revenue and expenses
which relate to 12b-1 fees that are received from certain fund clients for payment of
marketing, sales and service expenses also entirely offset each other, but are netted
for presentation purposes above.
(b) Net of nonoperating expense.
(c) Total operating income divided by total servicing revenue.
(d) Includes alternative investment net assets serviced.
Global Investment Servicing earned $122 million for 2008
and $128 million for 2007. Results for 2008 were negatively
impacted by declines in asset values and fund redemptions as
a result of severe deterioration of the financial markets during
the fourth quarter.
Highlights of Global Investment Servicing’s performance for
2008 included:
• Initiatives in the offshore arena resulted in a 13%
increase in offshore servicing revenue. This included
the start up of a new servicing location in Poland
which employed 69 individuals at year end. Assets
serviced, however, decreased by 38% as a direct
result of the unsettled global equity markets and the
resultant high redemption activity in the latter part of
the year.
• Subaccounting shareholder accounts rose by
5 million, or 9%, to 58 million, as existing clients
continued to convert additional fund families to this
platform. Global Investment Servicing remains a
leading provider of subaccounting services. A
prominent new client was won during 2008 due to
the combined subaccounting services and wealth
reporting capabilities that Global Investment
Servicing can now provide as a result of its
acquisition of Albridge Solutions in December 2007.
• Total accounting/administration funds serviced
increased 7% over the prior year. However, assets
serviced decreased 15% due to declines in asset
values and fund outflows resulting from market
conditions, primarily in the fourth quarter of 2008.
Servicing revenue for 2008 reached $947 million, an increase
of $84 million, or 10%, over 2007. This increase resulted
primarily from the acquisitions of Albridge Solutions and
Coates Analytics, LP in December 2007, growth in offshore
operations, and increased securities lending activities afforded
by the volatility in the markets.
Operating expense increased $91 million, or 14%, to $728
million, in 2008 compared with 2007. Investments in
technology, a larger employee base to support business
growth, and costs related to the acquisitions made in
December 2007 drove the higher expense level.
Debt financing costs and nonoperating income were both
lower than prior year levels due to the much lower interest rate
environment and principal payments on debt during the year.
Global Investment Servicing’s balance sheet was also
impacted by the market turmoil at year end as clients chose to
leave cash balances uninvested.
Total assets serviced by Global Investment Servicing totaled
$2.0 trillion at December 31, 2008 compared with $2.5 trillion
at December 31, 2007. The decline in assets serviced was a
direct result of global market declines.
54