PNC Bank 2008 Annual Report Download - page 124
Download and view the complete annual report
Please find page 124 of the 2008 PNC Bank annual report below. You can navigate through the pages in the report by either clicking on the pages listed below, or by using the keyword search tool below to find specific information within the annual report.-
 1
1 -
2
-
3
-
4
-
5
-
6
-
7
-
8
-
9
-
10
-
11
-
12
-
13
-
14
-
15
-
16
-
17
-
18
-
19
-
20
-
21
-
22
-
23
-
24
-
25
-
26
-
27
-
28
-
29
-
30
-
31
-
32
-
33
-
34
-
35
-
36
-
37
-
38
-
39
-
40
-
41
-
42
-
43
-
44
-
45
-
46
-
47
-
48
-
49
-
50
-
51
-
52
-
53
-
54
-
55
-
56
-
57
-
58
-
59
-
60
-
61
-
62
-
63
-
64
-
65
-
66
-
67
-
68
-
69
-
70
-
71
-
72
-
73
-
74
-
75
-
76
-
77
-
78
-
79
-
80
-
81
-
82
-
83
-
84
-
85
-
86
-
87
-
88
-
89
-
90
-
91
-
92
-
93
-
94
-
95
-
96
-
97
-
98
-
99
-
100
-
101
-
102
-
103
-
104
-
105
-
106
-
107
-
108
-
109
-
110
-
111
-
112
-
113
-
 114
114 -
 115
115 -
 116
116 -
 117
117 -
 118
118 -
 119
119 -
 120
120 -
 121
121 -
 122
122 -
 123
123 -
 124
124 -
 125
125 -
 126
126 -
 127
127 -
 128
128 -
 129
129 -
 130
130 -
 131
131 -
 132
132 -
 133
133 -
 134
134 -
135
-
136
-
137
-
138
-
139
-
140
-
141
-
142
-
143
-
144
-
145
-
146
-
147
-
148
-
149
-
150
-
151
-
152
-
153
-
154
-
155
-
156
-
157
-
158
-
159
-
160
-
161
-
162
-
163
-
164
-
165
-
166
-
167
-
168
-
169
-
170
-
171
-
172
-
173
-
174
-
175
-
176
-
177
-
178
-
179
-
180
-
181
-
182
-
183
-
184
 |
 |

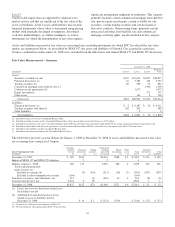
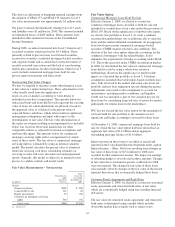
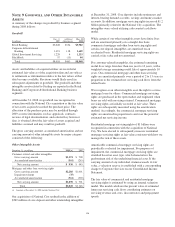
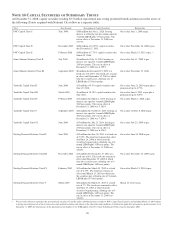
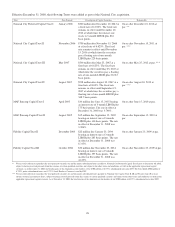
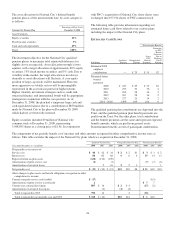
The tables below present the weighted-average assumptions used to measure the fair values of our acquired retained interests and
servicing assets as of December 31, 2008. Fair value was determined by discounting the future cash flows of these assets. The
sensitivity of these fair values to immediate 10% and 20% adverse changes in key assumptions is also shown. These sensitivities
are hypothetical. Changes in fair value based on a 10% variation in assumptions generally cannot be extrapolated because the
relationship of the change in the assumption to the change in fair value may not be linear. Also, the effect of a variation in a
particular assumption on the fair value of the retained interests is calculated without changing any other assumption; in reality,
changes in one factor may result in changes in another (for example, increases in market interest rates may result in lower
prepayments and increased credit losses), which might magnify or counteract the sensitivities.
Credit Card Loans
December 31, 2008
Dollars in millions
Fair
Value
Weighted-
Average
Life
(in months)
Variable
Annual
Coupon
Rate To
Investors
Monthly
Principal
Repayment
Rate
Expected
Annual
Credit
Losses
Annual
Discount
Rate Yield
Interest-only strip (a) $19.6 3.3 1.19% 17.54% 5.18% 15.00% 12.55%
Decline in fair value:
10% adverse change $ .1 $ 1.4 $ 2.3 $ 5.4
20% adverse change $ .3 $ 2.6 $ 4.7 $ 10.8
(a) Series 2005-1, 2006-1, 2007-1, 2008-1, 2008-2, and 2008-3.
Automobile Loans
December 31, 2008
Dollars in millions
Fair
Value
Weighted-
Average Life
(in months)
Monthly
Prepayment Speed
(% ABS) (a)
Expected
Cumulative
Credit
Losses
Annual
Discount
Rate
Weighted-
Average
Coupon
Interest-only strip (b) $9.2 1.7 1.26% 1.49% 12.00% 7.06%
Decline in fair value:
10% adverse change $.2 $ .5 $.5
20% adverse change $ .4 $ .1 $ 1.0
Servicing asset (b) $ .6 2.6 1.26% 1.49% 10.00% 7.06%
Decline in fair value:
10% adverse change
20% adverse change $.1
(a) Absolute prepayment speed.
(b) Series 2005-A.
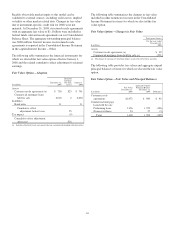
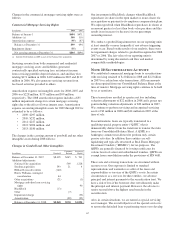
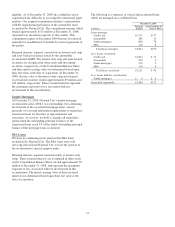
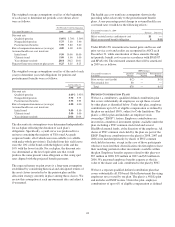
N
OTE
11 P
REMISES
,E
QUIPMENT AND
L
EASEHOLD
I
MPROVEMENTS
Premises, equipment and leasehold improvements, stated at
cost less accumulated depreciation and amortization, were as
follows:
December 31 - in millions 2008 (a) 2007
Land $ 577 $ 250
Buildings 1,215 1,053
Equipment 2,773 2,029
Leasehold improvements 531 433
Total 5,096 3,765
Accumulated depreciation and amortization (1,867) (1,764)
Net book value $ 3,229 $ 2,001
(a) Amounts at December 31, 2008 included $1.2 billion related to National City.
Depreciation expense on premises, equipment and leasehold
improvements totaled $225 million in 2008, $178 million in
2007 and $180 million in 2006. Amortization expense,
primarily for capitalized internally developed software, was
$44 million in 2008, $40 million in 2007 and $44 million in
2006.
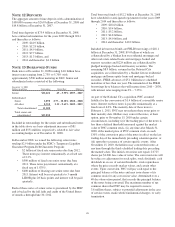
We lease certain facilities and equipment under agreements
expiring at various dates through the year 2067. We account
for these as operating leases. Rental expense on such leases
amounted to $202 million in 2008, $207 million in 2007 and
$193 million in 2006.
Required minimum annual rentals that we owe on
noncancelable leases having initial or remaining terms in
excess of one year totaled $2.6 billion at December 31, 2008
and $1.2 billion at December 31, 2007. Minimum annual
rentals for the years 2009 through 2014 and thereafter are as
follows:
• 2009: $329 million,
• 2010: $309 million,
• 2011: $270 million,
• 2012: $242 million,
• 2013: $217 million, and
• 2014 and thereafter: $1.2 billion.
120