PNC Bank 2008 Annual Report Download - page 110
Download and view the complete annual report
Please find page 110 of the 2008 PNC Bank annual report below. You can navigate through the pages in the report by either clicking on the pages listed below, or by using the keyword search tool below to find specific information within the annual report.-
 1
1 -
2
-
3
-
4
-
5
-
6
-
7
-
8
-
9
-
10
-
11
-
12
-
13
-
14
-
15
-
16
-
17
-
18
-
19
-
20
-
21
-
22
-
23
-
24
-
25
-
26
-
27
-
28
-
29
-
30
-
31
-
32
-
33
-
34
-
35
-
36
-
37
-
38
-
39
-
40
-
41
-
42
-
43
-
44
-
45
-
46
-
47
-
48
-
49
-
50
-
51
-
52
-
53
-
54
-
55
-
56
-
57
-
58
-
59
-
60
-
61
-
62
-
63
-
64
-
65
-
66
-
67
-
68
-
69
-
70
-
71
-
72
-
73
-
74
-
75
-
76
-
77
-
78
-
79
-
80
-
81
-
82
-
83
-
84
-
85
-
86
-
87
-
88
-
89
-
90
-
91
-
92
-
93
-
94
-
95
-
96
-
97
-
98
-
99
-
 100
100 -
 101
101 -
 102
102 -
 103
103 -
 104
104 -
 105
105 -
 106
106 -
 107
107 -
 108
108 -
 109
109 -
 110
110 -
 111
111 -
 112
112 -
 113
113 -
 114
114 -
 115
115 -
 116
116 -
 117
117 -
 118
118 -
 119
119 -
 120
120 -
121
-
122
-
123
-
124
-
125
-
126
-
127
-
128
-
129
-
130
-
131
-
132
-
133
-
134
-
135
-
136
-
137
-
138
-
139
-
140
-
141
-
142
-
143
-
144
-
145
-
146
-
147
-
148
-
149
-
150
-
151
-
152
-
153
-
154
-
155
-
156
-
157
-
158
-
159
-
160
-
161
-
162
-
163
-
164
-
165
-
166
-
167
-
168
-
169
-
170
-
171
-
172
-
173
-
174
-
175
-
176
-
177
-
178
-
179
-
180
-
181
-
182
-
183
-
184
 |
 |
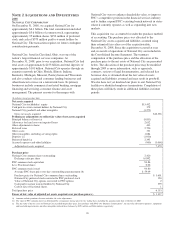
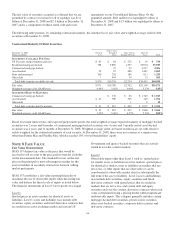
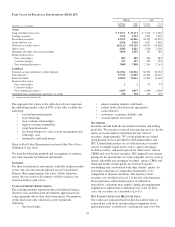
Net interest income less the provision for credit losses was
$2.306 billion for 2008 compared with $2.600 billion for 2007
and $2.121 billion for 2006.
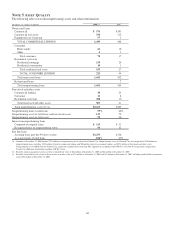
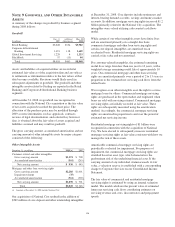
Changes in the allowance for loan and lease losses were as
follows:
In millions 2008 2007 2006
January 1 $ 830 $ 560 $ 596
Charge-offs (618) (245) (180)
Recoveries 79 45 40
Net charge-offs (539) (200) (140)
Provision for credit losses (a) 1,517 315 124
Acquired allowance – National City 2,224
Acquired allowance – other (b) 20 152
Net change in allowance for unfunded
loan commitments and letters of credit (135) 3 (20)
December 31 $3,917 $ 830 $ 560
(a) Amount for 2008 includes conforming provision adjustments of $504 million related
to National City and $23 million related to Sterling. Amount for 2007 includes a
conforming provision adjustment of $45 million related to Yardville.
(b) Sterling in 2008. Amount for 2007 includes $137 million related to Mercantile and
$15 million related to Yardville.
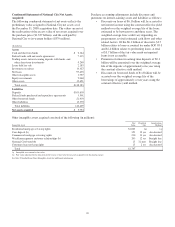
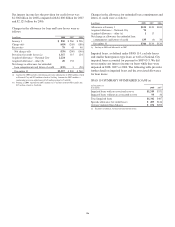
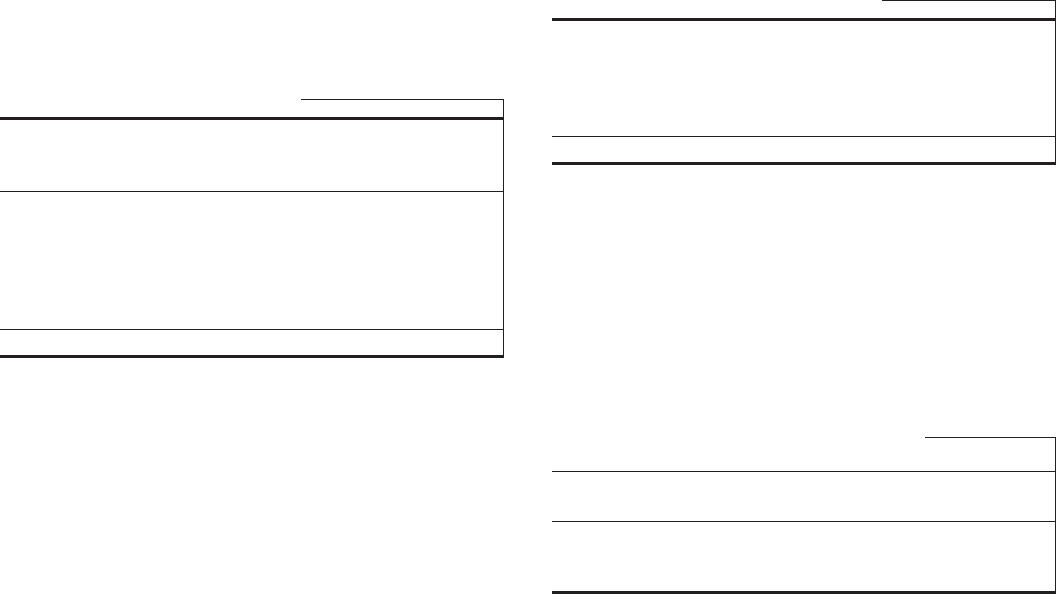
Changes in the allowance for unfunded loan commitments and
letters of credit were as follows:
In millions 2008 2007 2006
Allowance at January 1 $134 $120 $100
Acquired allowance – National City 74
Acquired allowance – other (a) 117
Net change in allowance for unfunded loan
commitments and letters of credit 135 (3) 20
December 31 $344 $134 $120
(a) Sterling in 2008 and Mercantile in 2007.
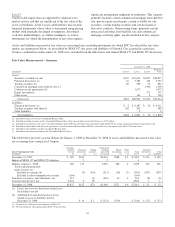
Impaired loans, as defined under SFAS 114, exclude leases
and smaller homogenous type loans as well as National City
impaired loans accounted for pursuant to SOP 03-3. We did
not recognize any interest income on loans while they were
impaired in 2008, 2007 or 2006. The following table provides
further detail on impaired loans and the associated allowance
for loan losses:
SFAS 114 SUMMARY OF IMPAIRED LOANS (a)
At December 31
In millions 2008 2007
Impaired loans with an associated reserve $1,249 $371
Impaired loans without an associated reserve 93 36
Total impaired loans $1,342 $407
Specific allowance for credit losses $ 405 $124
Average impaired loan balance $ 674 $200
(a) Excludes residential, leasing and construction loans.
106