PNC Bank 2008 Annual Report Download - page 40
Download and view the complete annual report
Please find page 40 of the 2008 PNC Bank annual report below. You can navigate through the pages in the report by either clicking on the pages listed below, or by using the keyword search tool below to find specific information within the annual report.-
 1
1 -
2
-
3
-
4
-
5
-
6
-
7
-
8
-
9
-
10
-
11
-
12
-
13
-
14
-
15
-
16
-
17
-
18
-
19
-
20
-
21
-
22
-
23
-
24
-
25
-
26
-
27
-
28
-
29
-
 30
30 -
 31
31 -
 32
32 -
 33
33 -
 34
34 -
 35
35 -
 36
36 -
 37
37 -
 38
38 -
 39
39 -
 40
40 -
 41
41 -
 42
42 -
 43
43 -
 44
44 -
 45
45 -
 46
46 -
 47
47 -
 48
48 -
 49
49 -
 50
50 -
51
-
52
-
53
-
54
-
55
-
56
-
57
-
58
-
59
-
60
-
61
-
62
-
63
-
64
-
65
-
66
-
67
-
68
-
69
-
70
-
71
-
72
-
73
-
74
-
75
-
76
-
77
-
78
-
79
-
80
-
81
-
82
-
83
-
84
-
85
-
86
-
87
-
88
-
89
-
90
-
91
-
92
-
93
-
94
-
95
-
96
-
97
-
98
-
99
-
100
-
101
-
102
-
103
-
104
-
105
-
106
-
107
-
108
-
109
-
110
-
111
-
112
-
113
-
114
-
115
-
116
-
117
-
118
-
119
-
120
-
121
-
122
-
123
-
124
-
125
-
126
-
127
-
128
-
129
-
130
-
131
-
132
-
133
-
134
-
135
-
136
-
137
-
138
-
139
-
140
-
141
-
142
-
143
-
144
-
145
-
146
-
147
-
148
-
149
-
150
-
151
-
152
-
153
-
154
-
155
-
156
-
157
-
158
-
159
-
160
-
161
-
162
-
163
-
164
-
165
-
166
-
167
-
168
-
169
-
170
-
171
-
172
-
173
-
174
-
175
-
176
-
177
-
178
-
179
-
180
-
181
-
182
-
183
-
184
 |
 |

Capital
We manage our capital position by making adjustments to our
balance sheet size and composition, issuing debt, equity or
hybrid instruments, executing treasury stock transactions,
managing dividend policies and retaining earnings. On
March 1, 2009, we took a proactive step to build capital and
further strengthen our balance sheet as the Board of Directors
decided to reduce PNC’s quarterly common stock dividend
from $0.66 to $0.10 per share.
Total shareholders’ equity increased $10.6 billion, to $25.4
billion, at December 31, 2008 compared with December 31,
2007 and reflected the following:
• The December 2008 issuance of $7.6 billion of
preferred stock and a common stock warrant to the
US Department of Treasury under the TARP Capital
Purchase Program,
• The December 2008 issuance of $5.6 billion of
common stock in connection with the National City
acquisition,
• The May 2008 issuance of $500 million of Series K
preferred stock,
• The April 2008 issuance of $312 million of common
stock in connection with the Sterling acquisition, and
• The December 2008 issuance of $150 million of
Series L preferred stock in connection with the
National City acquisition.
These factors were partially offset by the $3.8 billion increase
from December 31, 2007 in accumulated other comprehensive
loss which included $3.5 billion of net unrealized securities
losses. The Investment Securities section of this Consolidated
Balance Sheet Review includes additional information
regarding these unrealized losses.
Common shares outstanding were 443 million at
December 31, 2008 and 341 million at December 31, 2007.
PNC issued approximately 95 million common shares in
December 2008 and 4.6 million common shares in April 2008
in connection with the closings of the National City and
Sterling acquisitions, respectively.
Our current common stock repurchase program permits us to
purchase up to 25 million shares of PNC common stock on the
open market or in privately negotiated transactions. This
program will remain in effect until fully utilized or until
modified, superseded or terminated. The extent and timing of
share repurchases under this program will depend on a number
of factors including, among others, market and general
economic conditions, economic and regulatory capital
considerations, alternative uses of capital, regulatory and
contractual limitations, and the potential impact on our credit
ratings. We did not purchase any shares during 2008 under
this program. During 2007, we purchased 11 million common
shares under our current and prior common stock repurchase
programs at a total cost of approximately $800 million.
Under the TARP Capital Purchase Program, there are
restrictions on dividends and common share repurchases
associated with the preferred stock that we issued to the US
Treasury in accordance with that program. As is typical with
cumulative preferred stock, dividend payments for this
preferred stock must be current before dividends can be paid on
junior shares, including our common stock, or junior shares can
be repurchased or redeemed. Also, the US Treasury’s consent
will be required for any increase in common dividends per share
above the most recent level prior to October 14, 2008 until the
third anniversary of the preferred stock issuance as long as the
US Treasury continues to hold any of the preferred stock.
Further, during that same period, the US Treasury’s consent
will be required, unless the preferred stock is no longer held by
the US Treasury, for any share repurchases with limited
exceptions, most significantly purchases of common shares in
connection with any benefit plan in the ordinary course of
business consistent with past practice.
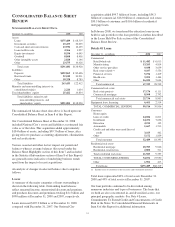
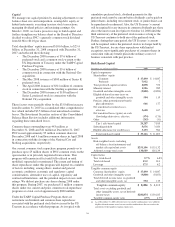
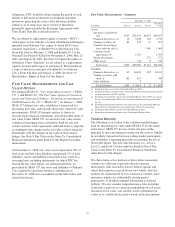
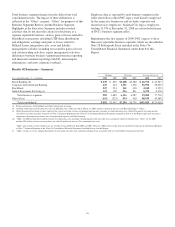
Risk-Based Capital
December 31 - dollars in millions 2008 2007
Capital components
Shareholders’ equity
Common $ 17,490 $ 14,847
Preferred 7,932 7
Trust preferred capital securities 2,898 572
Minority interest 1,506 985
Goodwill and other intangible assets (9,800) (8,853)
Eligible deferred income taxes on
goodwill and other intangible assets 594 119
Pension, other postretirement benefit
plan adjustments 666 177
Net unrealized securities losses,
after-tax 3,618 167
Net unrealized losses (gains) on cash
flow hedge derivatives, after-tax (374) (175)
Other (243) (31)
Tier 1 risk-based capital 24,287 7,815
Subordinated debt 5,676 3,024
Eligible allowance for credit losses 3,153 964
Total risk-based capital $ 33,116 $ 11,803
Assets
Risk-weighted assets, including
off-balance sheet instruments and
market risk equivalent assets $251,106 $115,132
Adjusted average total assets 138,689 126,139
Capital ratios
Tier 1 risk-based 9.7% 6.8%
Total risk-based 13.2 10.3
Leverage 17.5 6.2
Tangible common equity
Common shareholders’ equity $ 17,490 $ 14,847
Goodwill and other intangible assets (9,800) (8,853)
Total deferred income taxes on goodwill
and other intangible assets (a) 594 119
Tangible common equity $ 8,284 $ 6,113
Total assets excluding goodwill and
other intangible assets, net of deferred
income taxes $281,874 $130,185
Tangible common equity ratio 2.9% 4.7%
(a) As of December 31, 2008, deferred taxes on taxable combinations were added to
eligible deferred income taxes for non-taxable combinations that are used in the
calculation of the tangible common equity ratio.
36