PNC Bank 2008 Annual Report Download - page 160
Download and view the complete annual report
Please find page 160 of the 2008 PNC Bank annual report below. You can navigate through the pages in the report by either clicking on the pages listed below, or by using the keyword search tool below to find specific information within the annual report.-
 1
1 -
2
-
3
-
4
-
5
-
6
-
7
-
8
-
9
-
10
-
11
-
12
-
13
-
14
-
15
-
16
-
17
-
18
-
19
-
20
-
21
-
22
-
23
-
24
-
25
-
26
-
27
-
28
-
29
-
30
-
31
-
32
-
33
-
34
-
35
-
36
-
37
-
38
-
39
-
40
-
41
-
42
-
43
-
44
-
45
-
46
-
47
-
48
-
49
-
50
-
51
-
52
-
53
-
54
-
55
-
56
-
57
-
58
-
59
-
60
-
61
-
62
-
63
-
64
-
65
-
66
-
67
-
68
-
69
-
70
-
71
-
72
-
73
-
74
-
75
-
76
-
77
-
78
-
79
-
80
-
81
-
82
-
83
-
84
-
85
-
86
-
87
-
88
-
89
-
90
-
91
-
92
-
93
-
94
-
95
-
96
-
97
-
98
-
99
-
100
-
101
-
102
-
103
-
104
-
105
-
106
-
107
-
108
-
109
-
110
-
111
-
112
-
113
-
114
-
115
-
116
-
117
-
118
-
119
-
120
-
121
-
122
-
123
-
124
-
125
-
126
-
127
-
128
-
129
-
130
-
131
-
132
-
133
-
134
-
135
-
136
-
137
-
138
-
139
-
140
-
141
-
142
-
143
-
144
-
145
-
146
-
147
-
148
-
149
-
 150
150 -
 151
151 -
 152
152 -
 153
153 -
 154
154 -
 155
155 -
 156
156 -
 157
157 -
 158
158 -
 159
159 -
 160
160 -
 161
161 -
 162
162 -
 163
163 -
 164
164 -
 165
165 -
 166
166 -
 167
167 -
 168
168 -
 169
169 -
 170
170 -
171
-
172
-
173
-
174
-
175
-
176
-
177
-
178
-
179
-
180
-
181
-
182
-
183
-
184
 |
 |

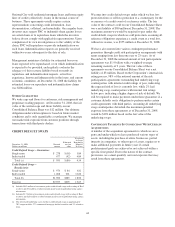
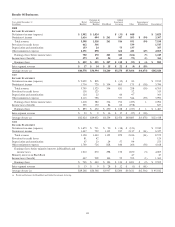
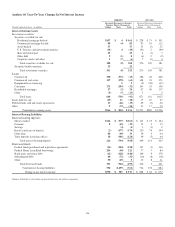
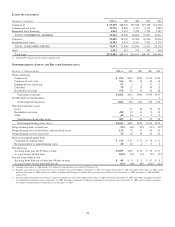
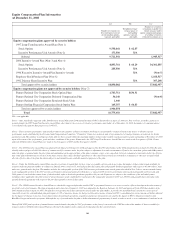
Analysis Of Year-To-Year Changes In Net Interest Income
2008/2007 2007/2006
Increase/(Decrease) in Income/
Expense Due to Changes in:
Increase/(Decrease) in Income/
Expense Due to Changes in:
Taxable-equivalent basis - in millions Volume Rate Total Volume Rate Total
Interest-Earning Assets
Investment securities
Securities available for sale
Residential mortgage-backed $157 $ 4 $ 161 $ 228 $ 73 $ 301
Commercial mortgage-backed 89 (4) 85 93 19 112
Asset-backed 37 37 55 (3) 52
U.S. Treasury and government agencies (14) 4 (10) (91) 2 (89)
State and municipal 25 25 4 (1) 3
Other debt 9 (1) 8 (4) 2 (2)
Corporate stocks and other 1 (7) (6) 7 (3) 4
Total securities available for sale 308 (8) 300 276 105 381
Securities held to maturity 23 23
Total investment securities 331 (8) 323 276 105 381
Loans
Commercial 358 (373) (15) 386 22 408
Commercial real estate 117 (178) (61) 348 23 371
Equipment lease financing 55 (9) (38) (47)
Consumer 171 (203) (32) 103 55 158
Residential mortgage 27 (3) 24 97 40 137
Other (8) (5) (13) 55
Total loans 644 (736) (92) 871 161 1,032
Loans held for sale (29) 11 (18) 17 10 27
Federal funds sold and resale agreements 13 (46) (33) 49 (3) 46
Other 9 (33) (24) 53 17 70
Total interest-earning assets $966 $ (810) $ 156 $1,271 $285 $1,556
Interest-Bearing Liabilities
Interest-bearing deposits
Money market $116 $ (377) $(261) $ 141 $ 23 $ 164
Demand 8 (43) (35) 12 3 15
Savings (4) (4) 3 (1) 2
Retail certificates of deposit (2) (177) (179) 120 74 194
Other time 88 (49) 39 39 5 44
Time deposits in foreign offices 18 (146) (128) 49 (5) 44
Total interest-bearing deposits 226 (794) (568) 349 114 463
Borrowed funds
Federal funds purchased and repurchase agreements (34) (204) (238) 137 (1) 136
Federal Home Loan Bank borrowings 256 (44) 212 77 7 84
Bank notes and senior debt (12) (128) (140) 169 9 178
Subordinated debt 40 (72) (32) (10) (8) (18)
Other 50 (45) 5 33 8 41
Total borrowed funds 351 (544) (193) 416 5 421
Total interest-bearing liabilities 534 (1,295) (761) 714 170 884
Change in net interest income $530 $ 387 $ 917 $ 608 $ 64 $ 672
Changes attributable to rate/volume are prorated into rate and volume components.
156