PNC Bank 2008 Annual Report Download - page 49
Download and view the complete annual report
Please find page 49 of the 2008 PNC Bank annual report below. You can navigate through the pages in the report by either clicking on the pages listed below, or by using the keyword search tool below to find specific information within the annual report.-
 1
1 -
2
-
3
-
4
-
5
-
6
-
7
-
8
-
9
-
10
-
11
-
12
-
13
-
14
-
15
-
16
-
17
-
18
-
19
-
20
-
21
-
22
-
23
-
24
-
25
-
26
-
27
-
28
-
29
-
30
-
31
-
32
-
33
-
34
-
35
-
36
-
37
-
38
-
 39
39 -
 40
40 -
 41
41 -
 42
42 -
 43
43 -
 44
44 -
 45
45 -
 46
46 -
 47
47 -
 48
48 -
 49
49 -
 50
50 -
 51
51 -
 52
52 -
 53
53 -
 54
54 -
 55
55 -
 56
56 -
 57
57 -
 58
58 -
 59
59 -
60
-
61
-
62
-
63
-
64
-
65
-
66
-
67
-
68
-
69
-
70
-
71
-
72
-
73
-
74
-
75
-
76
-
77
-
78
-
79
-
80
-
81
-
82
-
83
-
84
-
85
-
86
-
87
-
88
-
89
-
90
-
91
-
92
-
93
-
94
-
95
-
96
-
97
-
98
-
99
-
100
-
101
-
102
-
103
-
104
-
105
-
106
-
107
-
108
-
109
-
110
-
111
-
112
-
113
-
114
-
115
-
116
-
117
-
118
-
119
-
120
-
121
-
122
-
123
-
124
-
125
-
126
-
127
-
128
-
129
-
130
-
131
-
132
-
133
-
134
-
135
-
136
-
137
-
138
-
139
-
140
-
141
-
142
-
143
-
144
-
145
-
146
-
147
-
148
-
149
-
150
-
151
-
152
-
153
-
154
-
155
-
156
-
157
-
158
-
159
-
160
-
161
-
162
-
163
-
164
-
165
-
166
-
167
-
168
-
169
-
170
-
171
-
172
-
173
-
174
-
175
-
176
-
177
-
178
-
179
-
180
-
181
-
182
-
183
-
184
 |
 |
direct and affiliated partnership interests reflect the expected
exit price and are based on various techniques including
publicly traded price, multiples of adjusted earnings of the
entity, independent appraisals, anticipated financing and sale
transactions with third parties, or the pricing used to value the
entity in a recent financing transaction. Indirect investments in
private equity funds are valued based on the financial
statements that we receive from their managers. Due to the
time lag in our receipt of the financial information and based
on a review of investments and valuation techniques applied,
adjustments to the manager provided value are made when
available recent portfolio company information or market
information indicates a significant change in value from that
provided by the manager of the fund. These investments are
classified as Level 3.
Level 3 Assets and Liabilities
Under SFAS 157, financial instruments are considered Level 3
when their values are determined using pricing models,
discounted cash flow methodologies or similar techniques and
at least one significant model assumption or input is
unobservable. At December 31, 2008, Level 3 fair value assets
of $7.012 billion represented 19% of total assets at fair value
and 2% of total assets. Level 3 fair value liabilities of $22
million at December 31, 2008 represented less than 1% of
total liabilities at fair value and less than 1% of total liabilities
at that date.
During 2008, securities transferred into Level 3 from Level 2
exceeded securities transferred out by $4.3 billion. These
primarily related to private issuer asset-backed securities,
auction rate securities, residential mortgage-backed securities
and corporate bonds and occurred due to reduced volume of
recently executed transactions and the lack of corroborating
market price quotations for these instruments. Other Level 3
assets include commercial mortgage loans held for sale,
private equity investments and other assets.
Total securities measured at fair value at December 31, 2008
included securities available for sale and trading securities
consisting primarily of residential and commercial mortgage-
backed securities and other asset-backed securities. Unrealized
gains and losses on available for sale securities do not impact
liquidity or risk-based capital. However, reductions in the
credit ratings of these securities would have an impact on the
determination of risk-weighted assets which could reduce our
regulatory capital ratios. In addition, other-than-temporary
impairments on available for sale securities would reduce our
regulatory capital ratios.
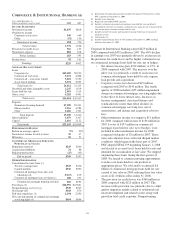
B
USINESS
S
EGMENTS
R
EVIEW
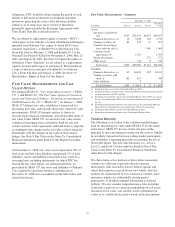
In 2008 and 2007, we had four major businesses engaged in
providing banking, asset management and global fund
processing products and services. Business segment results,
including inter-segment revenues, and a description of each
business are included in Note 27 Segment Reporting included
in the Notes To Consolidated Financial Statements under
Item 8 of this Report.
Certain revenue and expense amounts included in this
Business Segments Review differ from the amounts shown in
Note 27 due to the presentation in this Business Segments
Review of business revenue on a taxable-equivalent basis,
income statement classification differences related to Global
Investment Servicing, the inclusion of the results of Hilliard
Lyons, including the March 2008 gain on sale, in the “Other”
category, and the inclusion of 2008 Albridge Solutions and
Coates Analytics and 2007 BlackRock/MLIM transaction
integration costs in the “Other” category.
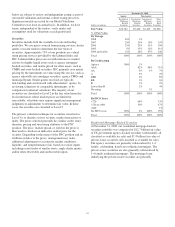
Results of individual businesses are presented based on our
management accounting practices and management structure.
There is no comprehensive, authoritative body of guidance for
management accounting equivalent to GAAP; therefore, the
financial results of our individual businesses are not
necessarily comparable with similar information for any other
company. We refine our methodologies from time to time as
our management accounting practices are enhanced and our
businesses and management structure change. Financial
results are presented, to the extent practicable, as if each
business operated on a stand-alone basis. As permitted under
GAAP, we have aggregated the business results for certain
similar operating segments for financial reporting purposes.
Assets receive a funding charge and liabilities and capital
receive a funding credit based on a transfer pricing
methodology that incorporates product maturities, duration
and other factors. Capital is intended to cover unexpected
losses and is assigned to the banking and servicing businesses
using our risk-based economic capital model. We have
assigned capital equal to 6% of funds to Retail Banking to
reflect the capital required for well-capitalized domestic banks
and to approximate market comparables for this business. The
capital assigned for Global Investment Servicing reflects its
legal entity shareholder’s equity.
We have allocated the allowances for loan and lease losses
and unfunded loan commitments and letters of credit based on
our assessment of risk inherent in the business segment loan
portfolios. Our allocation of the costs incurred by operations
and other shared support areas not directly aligned with the
businesses is primarily based on the use of services.
45