PNC Bank 2008 Annual Report Download - page 135
Download and view the complete annual report
Please find page 135 of the 2008 PNC Bank annual report below. You can navigate through the pages in the report by either clicking on the pages listed below, or by using the keyword search tool below to find specific information within the annual report.-
 1
1 -
2
-
3
-
4
-
5
-
6
-
7
-
8
-
9
-
10
-
11
-
12
-
13
-
14
-
15
-
16
-
17
-
18
-
19
-
20
-
21
-
22
-
23
-
24
-
25
-
26
-
27
-
28
-
29
-
30
-
31
-
32
-
33
-
34
-
35
-
36
-
37
-
38
-
39
-
40
-
41
-
42
-
43
-
44
-
45
-
46
-
47
-
48
-
49
-
50
-
51
-
52
-
53
-
54
-
55
-
56
-
57
-
58
-
59
-
60
-
61
-
62
-
63
-
64
-
65
-
66
-
67
-
68
-
69
-
70
-
71
-
72
-
73
-
74
-
75
-
76
-
77
-
78
-
79
-
80
-
81
-
82
-
83
-
84
-
85
-
86
-
87
-
88
-
89
-
90
-
91
-
92
-
93
-
94
-
95
-
96
-
97
-
98
-
99
-
100
-
101
-
102
-
103
-
104
-
105
-
106
-
107
-
108
-
109
-
110
-
111
-
112
-
113
-
114
-
115
-
116
-
117
-
118
-
119
-
120
-
121
-
122
-
123
-
124
-
 125
125 -
 126
126 -
 127
127 -
 128
128 -
 129
129 -
 130
130 -
 131
131 -
 132
132 -
 133
133 -
 134
134 -
 135
135 -
 136
136 -
 137
137 -
 138
138 -
 139
139 -
 140
140 -
 141
141 -
 142
142 -
 143
143 -
 144
144 -
 145
145 -
146
-
147
-
148
-
149
-
150
-
151
-
152
-
153
-
154
-
155
-
156
-
157
-
158
-
159
-
160
-
161
-
162
-
163
-
164
-
165
-
166
-
167
-
168
-
169
-
170
-
171
-
172
-
173
-
174
-
175
-
176
-
177
-
178
-
179
-
180
-
181
-
182
-
183
-
184
 |
 |

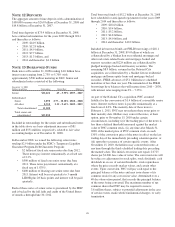
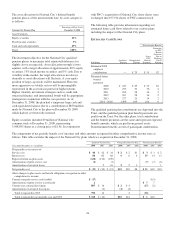
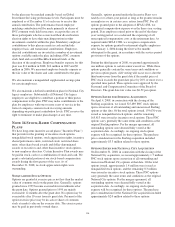
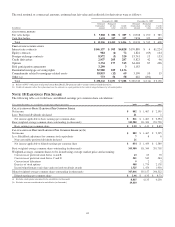
A summary of stock option activity follows:
Year ended December 31, 2008
In thousands, except
weighted-average data Shares
Weighted-
average
exercise
price
Weighted-
average
remaining
contractual
life
Aggregate
intrinsic
value
Outstanding, January 1 14,326 $ 62.15
Granted 3,308 60.35
Sterling acquisition 325 63.94
Exercised (3,175) 55.11
Cancelled (247) 57.97
Prior to National City
acquisition 14,537 63.39
National City acquisition 1,744 636.31
Outstanding, December 31 16,281 $124.75 5.6 years $4,909
Vested and expected to
vest, December 31 (a) 15,971 $125.90 5.6 years $4,909
Exercisable, December 31 11,373 $151.03 4.3 years $4,909
(a) Adjusted for estimated forfeitures on unvested options.
The weighted-average grant-date fair value of options granted
in 2008, 2007 and 2006 was $7.27, $11.37 and $10.75 per
option, respectively. To determine stock-based compensation
expense under SFAS 123R, the grant-date fair value is applied
to the options granted with a reduction made for estimated
forfeitures.
At December 31, 2007 and 2006, options for 10,496,000 and
10,743,000 shares of common stock, respectively, were
exercisable at a weighted-average price of $59.95 and $58.38,
respectively. The total intrinsic value of options exercised
during 2008, 2007 and 2006 was $59 million, $52 million and
$111 million, respectively.
Cash received from option exercises under all Incentive Plans
for 2008, 2007 and 2006 was approximately $167 million,
$111 million and $233 million, respectively. The actual tax
benefit realized for tax deduction purposes from option
exercises under all Incentive Plans for 2008, 2007 and 2006
was approximately $58 million, $39 million and $82 million,
respectively.
There were no options granted in excess of market value in
2008, 2007 or 2006. Shares of common stock available during
the next year for the granting of options and other awards
under the Incentive Plans were 36,307,172 at December 31,
2008. Total shares of PNC common stock authorized for
future issuance under equity compensation plans totaled
37,842,957 shares at December 31, 2008, which includes
shares available for issuance under the Incentive Plans, the
Employee Stock Purchase Plan as described below, and a
director plan.
During 2008, we issued approximately 3.1 million shares from
treasury stock in connection with stock option exercise
activity. As with past exercise activity, we intend to utilize
treasury stock for future stock option exercises.
As permitted under SFAS 123R, we recognized compensation
expense for stock options on a straight-line basis over the pro
rata vesting period. Total compensation expense recognized
related to PNC stock options in 2008 was $22 million
compared with $29 million in 2007 and $31 million in 2006.
Awards granted to non-employee directors in 2008 and 2007
include 25,381 and 20,944 deferred stock units, respectively,
awarded under the Outside Directors Deferred Stock Unit
Plan. A deferred stock unit is a phantom share of our common
stock, which requires liability accounting treatment under
SFAS 123R until such awards are paid to the participants as
cash. As there are no vesting or service requirements on these
awards, total compensation expense is recognized in full on all
awarded units on the date of grant.
O
PTION
P
RICING
A
SSUMPTIONS
For purposes of computing stock option expense, we
estimated the fair value of stock options primarily by using the
Black-Scholes option-pricing model. Option pricing models
require the use of numerous assumptions, many of which are
very subjective.
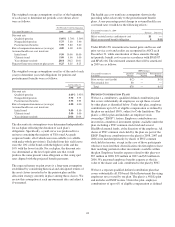
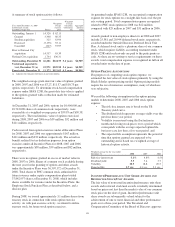
We used the following assumptions in the option pricing
models to determine 2008, 2007 and 2006 stock option
expense:
• The risk-free interest rate is based on the US
Treasury yield curve,
• The dividend yield represents average yields over the
previous three-year period,
• Volatility is measured using the fluctuation in
month-end closing stock prices over a period which
corresponds with the average expected option life,
but in no case less than a five-year period, and
• The expected life assumption represents the period of
time that options granted are expected to be
outstanding and is based on a weighted average of
historical option activity.
Weighted-average for the year ended
December 31 2008 2007 2006
Risk-free interest rate 3.1% 4.8% 4.5%
Dividend yield 3.3 3.4 3.7
Volatility 18.5 18.8 20.5
Expected life 5.7 yrs. 4.3 yrs. 5.1 yrs.
I
NCENTIVE
/P
ERFORMANCE
U
NIT
S
HARE
A
WARDS AND
R
ESTRICTED
S
TOCK
/U
NIT
A
WARDS
The fair value of nonvested incentive/performance unit share
awards and restricted stock/unit awards is initially determined
based on prices not less than the market value of our common
stock price on the date of grant. Incentive/performance unit
share awards are subsequently valued subject to the
achievement of one or more financial and other performance
goals over a three-year period. The Personnel and
Compensation Committee of the Board of Directors approves
131