PNC Bank 2008 Annual Report Download - page 55
Download and view the complete annual report
Please find page 55 of the 2008 PNC Bank annual report below. You can navigate through the pages in the report by either clicking on the pages listed below, or by using the keyword search tool below to find specific information within the annual report.-
 1
1 -
2
-
3
-
4
-
5
-
6
-
7
-
8
-
9
-
10
-
11
-
12
-
13
-
14
-
15
-
16
-
17
-
18
-
19
-
20
-
21
-
22
-
23
-
24
-
25
-
26
-
27
-
28
-
29
-
30
-
31
-
32
-
33
-
34
-
35
-
36
-
37
-
38
-
39
-
40
-
41
-
42
-
43
-
44
-
 45
45 -
 46
46 -
 47
47 -
 48
48 -
 49
49 -
 50
50 -
 51
51 -
 52
52 -
 53
53 -
 54
54 -
 55
55 -
 56
56 -
 57
57 -
 58
58 -
 59
59 -
 60
60 -
 61
61 -
 62
62 -
 63
63 -
 64
64 -
 65
65 -
66
-
67
-
68
-
69
-
70
-
71
-
72
-
73
-
74
-
75
-
76
-
77
-
78
-
79
-
80
-
81
-
82
-
83
-
84
-
85
-
86
-
87
-
88
-
89
-
90
-
91
-
92
-
93
-
94
-
95
-
96
-
97
-
98
-
99
-
100
-
101
-
102
-
103
-
104
-
105
-
106
-
107
-
108
-
109
-
110
-
111
-
112
-
113
-
114
-
115
-
116
-
117
-
118
-
119
-
120
-
121
-
122
-
123
-
124
-
125
-
126
-
127
-
128
-
129
-
130
-
131
-
132
-
133
-
134
-
135
-
136
-
137
-
138
-
139
-
140
-
141
-
142
-
143
-
144
-
145
-
146
-
147
-
148
-
149
-
150
-
151
-
152
-
153
-
154
-
155
-
156
-
157
-
158
-
159
-
160
-
161
-
162
-
163
-
164
-
165
-
166
-
167
-
168
-
169
-
170
-
171
-
172
-
173
-
174
-
175
-
176
-
177
-
178
-
179
-
180
-
181
-
182
-
183
-
184
 |
 |
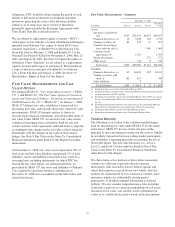
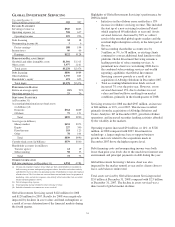
assets increased $506 million in the comparison. The
largest component of the increase was in commercial
real estate and commercial real estate related loans.
Based upon the current environment and the
acquisition of National City, we believe the provision
will continue to increase in 2009 versus 2008 levels.
• Noninterest expense increased $64 million, or 8%,
compared with 2007. The increase was primarily due
to the impact of the 2007 ARCS Commercial
Mortgage and Mercantile acquisitions, expenses
associated with revenue-related activities, growth
initiatives mainly in treasury management, higher
passive losses associated with low income housing
tax credit investments, and write-downs of other real
estate owned.
• Average loan balances increased $5.1 billion, or
24%, compared with 2007. The increase in corporate
and commercial real estate loans resulted from higher
utilization of credit facilities, organic growth from
new and existing clients, and the impact of the
Mercantile and Yardville acquisitions.
• Average deposit balances increased $1.7 billion, or
13%, compared with 2007. The increase resulted
primarily from higher time deposits and the impact of
acquisitions.
• The commercial mortgage servicing portfolio was
$249 billion at December 31, 2008, an increase of $6
billion from December 31, 2007. Servicing portfolio
additions were modest during 2008 due to the
declining volumes in the commercial mortgage
securitization market.
• Average other assets and other liabilities increased
$1.8 billion and $2.1 billion, respectively. These
increases were due to customer driven trading and
related hedging transactions. In addition, an increase
in customer driven money management activities
contributed to the higher other liabilities balance.
See the additional revenue discussion regarding treasury
management, capital markets-related products and services,
and commercial mortgage banking activities on pages 29 and
30.
51