PNC Bank 2008 Annual Report Download - page 26
Download and view the complete annual report
Please find page 26 of the 2008 PNC Bank annual report below. You can navigate through the pages in the report by either clicking on the pages listed below, or by using the keyword search tool below to find specific information within the annual report.-
 1
1 -
2
-
3
-
4
-
5
-
6
-
7
-
8
-
9
-
10
-
11
-
12
-
13
-
14
-
15
-
 16
16 -
 17
17 -
 18
18 -
 19
19 -
 20
20 -
 21
21 -
 22
22 -
 23
23 -
 24
24 -
 25
25 -
 26
26 -
 27
27 -
 28
28 -
 29
29 -
 30
30 -
 31
31 -
 32
32 -
 33
33 -
 34
34 -
 35
35 -
 36
36 -
37
-
38
-
39
-
40
-
41
-
42
-
43
-
44
-
45
-
46
-
47
-
48
-
49
-
50
-
51
-
52
-
53
-
54
-
55
-
56
-
57
-
58
-
59
-
60
-
61
-
62
-
63
-
64
-
65
-
66
-
67
-
68
-
69
-
70
-
71
-
72
-
73
-
74
-
75
-
76
-
77
-
78
-
79
-
80
-
81
-
82
-
83
-
84
-
85
-
86
-
87
-
88
-
89
-
90
-
91
-
92
-
93
-
94
-
95
-
96
-
97
-
98
-
99
-
100
-
101
-
102
-
103
-
104
-
105
-
106
-
107
-
108
-
109
-
110
-
111
-
112
-
113
-
114
-
115
-
116
-
117
-
118
-
119
-
120
-
121
-
122
-
123
-
124
-
125
-
126
-
127
-
128
-
129
-
130
-
131
-
132
-
133
-
134
-
135
-
136
-
137
-
138
-
139
-
140
-
141
-
142
-
143
-
144
-
145
-
146
-
147
-
148
-
149
-
150
-
151
-
152
-
153
-
154
-
155
-
156
-
157
-
158
-
159
-
160
-
161
-
162
-
163
-
164
-
165
-
166
-
167
-
168
-
169
-
170
-
171
-
172
-
173
-
174
-
175
-
176
-
177
-
178
-
179
-
180
-
181
-
182
-
183
-
184
 |
 |

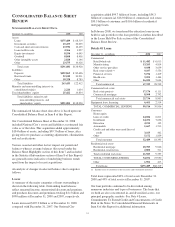
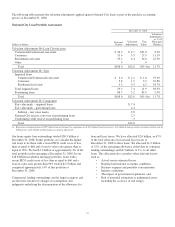
December 31
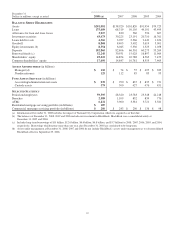
Dollars in millions, except as noted 2008 (a) 2007 2006 2005 2004
B
ALANCE
S
HEET
H
IGHLIGHTS
Assets $291,081 $138,920 $101,820 $91,954 $79,723
Loans 175,489 68,319 50,105 49,101 43,495
Allowance for loan and lease losses 3,917 830 560 596 607
Investment securities 43,473 30,225 23,191 20,710 16,761
Loans held for sale 4,366 3,927 2,366 2,449 1,670
Goodwill 8,868 8,405 3,402 3,619 3,001
Equity investments (b) 8,554 6,045 5,330 1,323 1,058
Deposits 192,865 82,696 66,301 60,275 53,269
Borrowed funds (c) 52,240 30,931 15,028 16,897 11,964
Shareholders’ equity 25,422 14,854 10,788 8,563 7,473
Common shareholders’ equity 17,490 14,847 10,781 8,555 7,465
A
SSETS
A
DMINISTERED
(in billions)
Managed (d) $ 110 $ 74 $ 55 $ 495 $ 383
Nondiscretionary 125 112 85 83 93
F
UND
A
SSETS
S
ERVICED
(in billions)
Accounting/administration net assets $ 839 $ 990 $ 837 $ 835 $ 721
Custody assets 379 500 427 476 451
S
ELECTED
S
TATISTICS
Period-end employees 59,595 28,320 23,783 25,348 24,218
Branches 2,589 1,109 852 839 776
ATMs 6,232 3,900 3,581 3,721 3,581
Residential mortgage servicing portfolio (in billions) $ 187
Commercial mortgage servicing portfolio (in billions) $ 286 $ 243 $ 200 $ 136 $ 98
(a) Information at December 31, 2008 includes the impact of National City Corporation, which we acquired as of that date.
(b) The balances at December 31, 2008, 2007 and 2006 include our investment in BlackRock. BlackRock was a consolidated entity at
December 31, 2005 and 2004.
(c) Includes long-term borrowings of $35 billion, $12.6 billion, $6.6 billion, $6.8 billion, and $5.7 billion for 2008, 2007, 2006, 2005, and 2004,
respectively. Borrowings which mature more than one year after December 31, 2008 are considered to be long-term.
(d) Assets under management at December 31, 2008, 2007 and 2006 do not include BlackRock’s assets under management as we deconsolidated
BlackRock effective September 29, 2006.
22