PNC Bank 2008 Annual Report Download - page 35
Download and view the complete annual report
Please find page 35 of the 2008 PNC Bank annual report below. You can navigate through the pages in the report by either clicking on the pages listed below, or by using the keyword search tool below to find specific information within the annual report.-
 1
1 -
2
-
3
-
4
-
5
-
6
-
7
-
8
-
9
-
10
-
11
-
12
-
13
-
14
-
15
-
16
-
17
-
18
-
19
-
20
-
21
-
22
-
23
-
24
-
 25
25 -
 26
26 -
 27
27 -
 28
28 -
 29
29 -
 30
30 -
 31
31 -
 32
32 -
 33
33 -
 34
34 -
 35
35 -
 36
36 -
 37
37 -
 38
38 -
 39
39 -
 40
40 -
 41
41 -
 42
42 -
 43
43 -
 44
44 -
 45
45 -
46
-
47
-
48
-
49
-
50
-
51
-
52
-
53
-
54
-
55
-
56
-
57
-
58
-
59
-
60
-
61
-
62
-
63
-
64
-
65
-
66
-
67
-
68
-
69
-
70
-
71
-
72
-
73
-
74
-
75
-
76
-
77
-
78
-
79
-
80
-
81
-
82
-
83
-
84
-
85
-
86
-
87
-
88
-
89
-
90
-
91
-
92
-
93
-
94
-
95
-
96
-
97
-
98
-
99
-
100
-
101
-
102
-
103
-
104
-
105
-
106
-
107
-
108
-
109
-
110
-
111
-
112
-
113
-
114
-
115
-
116
-
117
-
118
-
119
-
120
-
121
-
122
-
123
-
124
-
125
-
126
-
127
-
128
-
129
-
130
-
131
-
132
-
133
-
134
-
135
-
136
-
137
-
138
-
139
-
140
-
141
-
142
-
143
-
144
-
145
-
146
-
147
-
148
-
149
-
150
-
151
-
152
-
153
-
154
-
155
-
156
-
157
-
158
-
159
-
160
-
161
-
162
-
163
-
164
-
165
-
166
-
167
-
168
-
169
-
170
-
171
-
172
-
173
-
174
-
175
-
176
-
177
-
178
-
179
-
180
-
181
-
182
-
183
-
184
 |
 |

C
ONSOLIDATED
B
ALANCE
S
HEET
R
EVIEW
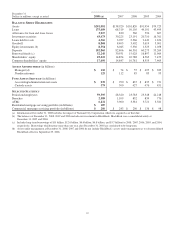
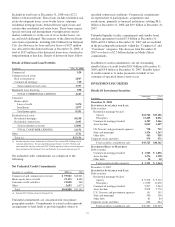
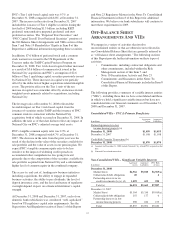
S
UMMARIZED
B
ALANCE
S
HEET
D
ATA
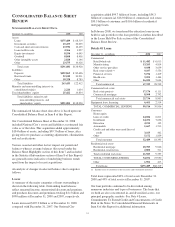
December 31 - in millions 2008 2007
Assets
Loans $175,489 $ 68,319
Investment securities 43,473 30,225
Cash and short-term investments 23,936 10,425
Loans held for sale 4,366 3,927
Equity investments 8,554 6,045
Goodwill 8,868 8,405
Other intangible assets 2,820 1,146
Other 23,575 10,428
Total assets $291,081 $138,920
Liabilities
Deposits $192,865 $ 82,696
Borrowed funds 52,240 30,931
Other 18,328 8,785
Total liabilities 263,433 122,412
Minority and noncontrolling interests in
consolidated entities 2,226 1,654
Total shareholders’ equity 25,422 14,854
Total liabilities, minority and
noncontrolling interests, and
shareholders’ equity $291,081 $138,920
The summarized balance sheet data above is based upon our
Consolidated Balance Sheet in Item 8 of this Report.
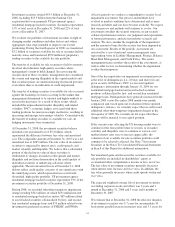
Our Consolidated Balance Sheet at December 31, 2008
included National City’s assets and liabilities at estimated fair
value as of that date. This acquisition added approximately
$134 billion of assets, including $99.7 billion of loans, after
giving effect to purchase accounting adjustments, eliminations
and reclassifications.
Various seasonal and other factors impact our period-end
balances whereas average balances (discussed under the
Balance Sheet Highlights section of this Item 7 and included
in the Statistical Information section of Item 8 of this Report)
are generally more indicative of underlying business trends
apart from the impact of recent acquisitions.
An analysis of changes in selected balance sheet categories
follows.
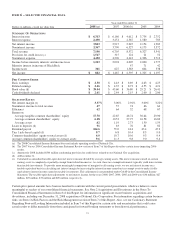
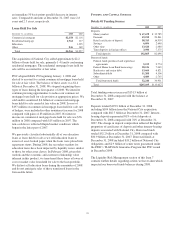
L
OANS
A summary of the major categories of loans outstanding is
shown in the following table. Outstanding loan balances
reflect unearned income, unamortized discount and premium,
and purchase discounts and premiums totaling $4.1 billion and
$990 million at December 31, 2008 and 2007, respectively.
Loans increased $107.2 billion as of December 31, 2008
compared with December 31, 2007. Our National City
acquisition added $99.7 billion of loans, including $34.3
billion of commercial, $16.0 billion of commercial real estate,
$30.5 billion of consumer and $10.6 billion of residential
mortgage loans.
In February 2008, we transferred the education loans in our
held for sale portfolio to the loan portfolio as further described
in the Loans Held For Sale section of this Consolidated
Balance Sheet Review.
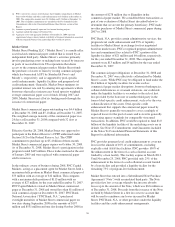
Details Of Loans
December 31 - in millions 2008 2007
Commercial
Retail/wholesale $ 11,482 $ 6,013
Manufacturing 13,263 4,814
Other service providers 9,038 3,639
Real estate related (a) 9,107 5,556
Financial services 5,194 1,419
Health care 3,201 1,464
Other 16,034 5,634
Total commercial 67,319 28,539
Commercial real estate
Real estate projects 17,176 6,111
Commercial mortgage 8,560 2,792
Total commercial real estate 25,736 8,903
Equipment lease financing 6,461 2,514
TOTAL COMMERCIAL LENDING 99,516 39,956
Consumer
Home equity
Lines of credit 24,024 6,811
Installment 14,252 7,636
Education 4,211 132
Automobile 1,667 1,513
Credit card and other unsecured lines of
credit 3,163 462
Other 5,172 1,839
Total consumer 52,489 18,393
Residential real estate
Residential mortgage 18,783 9,046
Residential construction 2,800 511
Total residential real estate 21,583 9,557
TOTAL CONSUMER LENDING 74,072 27,950
Other 1,901 413
Total loans $175,489 $68,319
(a) Includes loans to customers in the real estate and construction industries.
Total loans represented 60% of total assets December 31,
2008 and 49% of total assets at December 31, 2007.
Our loan portfolio continued to be diversified among
numerous industries and types of businesses. The loans that
we hold are also concentrated in, and diversified across, our
principal geographic markets. See Note 4 Loans,
Commitments To Extend Credit and Concentrations of Credit
Risk in the Notes To Consolidated Financial Statements in
Item 8 of this Report for additional information.
31