PNC Bank 2008 Annual Report Download - page 87
Download and view the complete annual report
Please find page 87 of the 2008 PNC Bank annual report below. You can navigate through the pages in the report by either clicking on the pages listed below, or by using the keyword search tool below to find specific information within the annual report.-
 1
1 -
2
-
3
-
4
-
5
-
6
-
7
-
8
-
9
-
10
-
11
-
12
-
13
-
14
-
15
-
16
-
17
-
18
-
19
-
20
-
21
-
22
-
23
-
24
-
25
-
26
-
27
-
28
-
29
-
30
-
31
-
32
-
33
-
34
-
35
-
36
-
37
-
38
-
39
-
40
-
41
-
42
-
43
-
44
-
45
-
46
-
47
-
48
-
49
-
50
-
51
-
52
-
53
-
54
-
55
-
56
-
57
-
58
-
59
-
60
-
61
-
62
-
63
-
64
-
65
-
66
-
67
-
68
-
69
-
70
-
71
-
72
-
73
-
74
-
75
-
76
-
 77
77 -
 78
78 -
 79
79 -
 80
80 -
 81
81 -
 82
82 -
 83
83 -
 84
84 -
 85
85 -
 86
86 -
 87
87 -
 88
88 -
 89
89 -
 90
90 -
 91
91 -
 92
92 -
 93
93 -
 94
94 -
 95
95 -
 96
96 -
 97
97 -
98
-
99
-
100
-
101
-
102
-
103
-
104
-
105
-
106
-
107
-
108
-
109
-
110
-
111
-
112
-
113
-
114
-
115
-
116
-
117
-
118
-
119
-
120
-
121
-
122
-
123
-
124
-
125
-
126
-
127
-
128
-
129
-
130
-
131
-
132
-
133
-
134
-
135
-
136
-
137
-
138
-
139
-
140
-
141
-
142
-
143
-
144
-
145
-
146
-
147
-
148
-
149
-
150
-
151
-
152
-
153
-
154
-
155
-
156
-
157
-
158
-
159
-
160
-
161
-
162
-
163
-
164
-
165
-
166
-
167
-
168
-
169
-
170
-
171
-
172
-
173
-
174
-
175
-
176
-
177
-
178
-
179
-
180
-
181
-
182
-
183
-
184
 |
 |

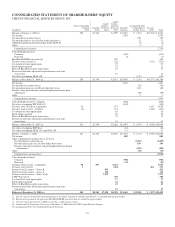
CONSOLIDATED STATEMENT OF SHAREHOLDERS’ EQUITY
THE PNC FINANCIAL SERVICES GROUP, INC.
In millions
Shares Outstanding
Common
Stock
Common
Stock
Capital
Surplus -
Preferred
Stock
Capital
Surplus -
Common
Stock and
Other
Retained
Earnings
Accumulated Other
Comprehensive
Income (Loss)
Treasury
Stock Total
Balance at January 1, 2006 (a) 293 $1,764 $1,299 $ 9,023 $ (267) $(3,256) $ 8,563
Net income 2,595 2,595
Net unrealized securities losses 149 149
Net unrealized losses on cash flow hedge derivatives 13 13
Additional minimum pension liability under SFAS 87 (1) (1)
Other 33
Comprehensive income 2,759
Cash dividends declared
Common (632) (632)
Preferred (1) (1)
BlackRock/MLIM transaction (b) 262 262
Treasury stock activity (c) (12) (121) (133)
Tax benefit of stock option plans 29 29
Stock options granted 31 31
Effect of BlackRock equity transactions 27 27
Restricted stock/unit and incentive/performance unit share
transactions 15 15
Net effect of adopting SFAS 158 (132) (132)
Balance at December 31, 2006 (a) 293 $1,764 $1,651 $10,985 $ (235) $(3,377) $10,788
Net income 1,467 1,467
Net unrealized securities losses (76) (76)
Net unrealized gains on cash flow hedge derivatives 188 188
Pension, other postretirement and postemployment benefit plan
adjustments (29) (29)
Other 55
Comprehensive income 1,555
Cash dividends declared – common (806) (806)
Net effect of adopting FSP FAS 13-2 (149) (149)
Treasury stock issued for acquisitions 56 872 3,147 4,019
Treasury stock activity – all other (8) (17) (648) (665)
Tax benefit of stock option plans 18 18
Stock options granted 28 28
Effect of BlackRock equity transactions 53 53
Restricted stock/unit and incentive/performance unit share
transactions 13 13
Balance at December 31, 2007 (a) 341 $1,764 $2,618 $11,497 $ (147) $ (878) $14,854
Net effect of adopting EITF 06-4 (12) (12)
Net effect of adopting SFAS 157 and SFAS 159 17 17
Balance at January 1, 2008 341 $1,764 $2,618 $11,502 $ (147) $ (878) $14,859
Net income 882 882
Other comprehensive income (loss), net of tax
Net unrealized securities losses (3,459) (3,459)
Net unrealized gains on cash flow hedge derivatives 199 199
Pension, other postretirement and postemployment benefit plan
adjustments (490) (490)
Other (52) (52)
Comprehensive income (loss) (2,920)
Cash dividends declared
Common (902) (902)
Preferred (21) (21)
Common stock activity – acquisition 99 497 5,419 5,916
Treasury stock activity 3 (110) 281 171
Preferred stock issuance – Series K 493 493
Preferred stock issuance – Series L 150 150
Preferred stock issuance – Series N (d) 7,275 7,275
TARP Warrant (d) 304 304
Tax benefit of stock option plans 17 17
Stock options granted 22 22
Effect of BlackRock equity transactions 43 43
Restricted stock/unit and incentive/performance unit share
transactions 15 15
Balance at December 31, 2008 (a) 443 $2,261 $7,918 $8,328 $11,461 $(3,949) $ (597) $25,422
(a) The par value of our preferred stock outstanding was less than $.5 million at each date and, therefore, is excluded from this presentation.
(b) Represents the portion of our gain on the BlackRock/MLIM transaction that was credited to capital surplus.
(c) Our net treasury stock activity in 2006 was less than .1 million shares issued.
(d) Issued to the US Department of Treasury on December 31, 2008 under the TARP Capital Purchase Program.
See accompanying Notes To Consolidated Financial Statements.
83