PNC Bank 2008 Annual Report Download - page 77
Download and view the complete annual report
Please find page 77 of the 2008 PNC Bank annual report below. You can navigate through the pages in the report by either clicking on the pages listed below, or by using the keyword search tool below to find specific information within the annual report.-
 1
1 -
2
-
3
-
4
-
5
-
6
-
7
-
8
-
9
-
10
-
11
-
12
-
13
-
14
-
15
-
16
-
17
-
18
-
19
-
20
-
21
-
22
-
23
-
24
-
25
-
26
-
27
-
28
-
29
-
30
-
31
-
32
-
33
-
34
-
35
-
36
-
37
-
38
-
39
-
40
-
41
-
42
-
43
-
44
-
45
-
46
-
47
-
48
-
49
-
50
-
51
-
52
-
53
-
54
-
55
-
56
-
57
-
58
-
59
-
60
-
61
-
62
-
63
-
64
-
65
-
66
-
 67
67 -
 68
68 -
 69
69 -
 70
70 -
 71
71 -
 72
72 -
 73
73 -
 74
74 -
 75
75 -
 76
76 -
 77
77 -
 78
78 -
 79
79 -
 80
80 -
 81
81 -
 82
82 -
 83
83 -
 84
84 -
 85
85 -
 86
86 -
 87
87 -
88
-
89
-
90
-
91
-
92
-
93
-
94
-
95
-
96
-
97
-
98
-
99
-
100
-
101
-
102
-
103
-
104
-
105
-
106
-
107
-
108
-
109
-
110
-
111
-
112
-
113
-
114
-
115
-
116
-
117
-
118
-
119
-
120
-
121
-
122
-
123
-
124
-
125
-
126
-
127
-
128
-
129
-
130
-
131
-
132
-
133
-
134
-
135
-
136
-
137
-
138
-
139
-
140
-
141
-
142
-
143
-
144
-
145
-
146
-
147
-
148
-
149
-
150
-
151
-
152
-
153
-
154
-
155
-
156
-
157
-
158
-
159
-
160
-
161
-
162
-
163
-
164
-
165
-
166
-
167
-
168
-
169
-
170
-
171
-
172
-
173
-
174
-
175
-
176
-
177
-
178
-
179
-
180
-
181
-
182
-
183
-
184
 |
 |
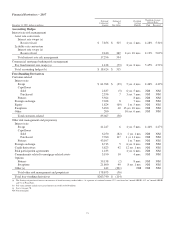
from commercial mortgage servicing including the impact of
the ARCS acquisition, treasury management, third party
consumer loan servicing activities and the Mercantile
acquisition contributed to the increase in 2007 over the prior
year.
Service charges on deposits increased $35 million, or 11%, to
$348 million for 2007 compared with 2006. The increase was
primarily due to the impact of Mercantile.
Net securities losses totaled $5 million in 2007 and $207
million in 2006. We took actions during the third quarter of
2006 that resulted in the sale of approximately $6 billion of
investment securities at an aggregate pretax loss of $196
million during that quarter.
Other noninterest income decreased $170 million, to $423
million, in 2007 compared with 2006. Net losses of $127
million in 2007 representing the net of the mark-to-market
adjustment on our LTIP obligation and gain recognized in
connection with our transfer of shares to satisfy a portion of
our LTIP obligation, compared with a net loss of $12 million
on our LTIP shares obligation in 2006, where such obligation
was applicable in the fourth quarter. Noninterest revenue from
trading activities totaled $104 million in 2007 compared with
$183 million in 2006. While customer trading income
increased in comparison, total trading revenue declined in
2007 largely due to the lower economic hedging gains
associated with commercial mortgage loan activity and
economic hedging losses associated with structured resale
agreements. Other noninterest income for 2006 included a $48
million loss incurred in the third quarter in connection with
the rebalancing of our residential mortgage portfolio.
Noninterest income for 2006 also included the $2.078 billion
gain on the BlackRock/MLIM transaction, whereas there was
no similar transaction in 2007.
Noninterest Expense
Total noninterest expense was $4.296 billion for 2007, a
decrease of $147 million compared with $4.443 billion for
2006.
Noninterest expense for 2007 included the following:
• Acquisition integration costs of $102 million, and
• A charge of $82 million for an indemnification
obligation related to certain Visa litigation.
Noninterest expense for 2006 included the following:
• The first nine months of 2006 included $765 million
of expenses related to BlackRock, which was still
consolidated during that time, and
• BlackRock/MLIM transaction integration costs
totaling $91 million.
Apart from the impact of these items, noninterest expense
increased $525 million, or 15%, in 2007 compared with 2006.
These increases were largely a result of the acquisition of
Mercantile. Investments in growth initiatives were mitigated
by disciplined expense management.
E
FFECTIVE
T
AX
R
ATE
Our effective tax rate was 29.9% for 2007 and 34% for 2006.
The lower effective tax rate in 2007 compared with the prior
year reflected the impact of the following matters:
• An increase in income taxes related to the gain from,
and a $57 million cumulative adjustment to increase
deferred income taxes in connection with, the
BlackRock/MLIM transaction in 2006, and
• Lower pretax income for the fourth quarter of 2007
had the impact of reducing the effective tax rate for
the full year.
C
ONSOLIDATED
B
ALANCE
S
HEET
R
EVIEW
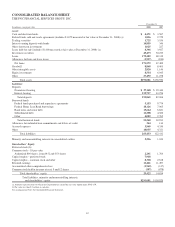
Loans
Loans increased $18.2 billion, or 36%, as of December 31,
2007 compared with December 31, 2006. Our Mercantile
acquisition added $12.4 billion of loans including $4.9 billion
of commercial, $4.8 billion of commercial real estate, $1.6
billion of consumer and $1.1 billion of residential mortgage
loans. Our Yardville acquisition added $1.9 billion of loans.
Securities
Total securities at December 31, 2007 were $30.2 billion
compared with $23.2 billion at December 31, 2006. Securities
represented 22% of total assets at December 31, 2007 and
23% of total assets at December 31, 2006. Our acquisition of
Mercantile included approximately $2 billion of securities
classified as available for sale. The increase in total securities
compared with December 31, 2006 was primarily due to
higher balances in residential mortgage-backed, commercial
mortgage-backed and asset-backed securities.
At December 31, 2007, the investment securities balance
included a net unrealized loss of $265 million, which
represented the difference between fair value and amortized
cost. The comparable amount at December 31, 2006 was a net
unrealized loss of $142 million. The expected weighted-
average life of investment securities (excluding corporate
stocks and other) was 3 years and 6 months at December 31,
2007 and 3 years and 8 months at December 31, 2006.
Loans Held For Sale
Loans held for sale totaled $3.9 billion at December 31, 2007
compared with $2.4 billion at December 31, 2006.
Loans held for sale included commercial mortgage loans
intended for securitization totaling $2.1 billion at
December 31, 2007 and $.9 billion at December 31, 2006. The
balance at December 31, 2007 increased as market conditions
were not conducive to completing securitization transactions
during the fourth quarter of 2007.
73