PNC Bank 2008 Annual Report Download - page 114
Download and view the complete annual report
Please find page 114 of the 2008 PNC Bank annual report below. You can navigate through the pages in the report by either clicking on the pages listed below, or by using the keyword search tool below to find specific information within the annual report.-
 1
1 -
2
-
3
-
4
-
5
-
6
-
7
-
8
-
9
-
10
-
11
-
12
-
13
-
14
-
15
-
16
-
17
-
18
-
19
-
20
-
21
-
22
-
23
-
24
-
25
-
26
-
27
-
28
-
29
-
30
-
31
-
32
-
33
-
34
-
35
-
36
-
37
-
38
-
39
-
40
-
41
-
42
-
43
-
44
-
45
-
46
-
47
-
48
-
49
-
50
-
51
-
52
-
53
-
54
-
55
-
56
-
57
-
58
-
59
-
60
-
61
-
62
-
63
-
64
-
65
-
66
-
67
-
68
-
69
-
70
-
71
-
72
-
73
-
74
-
75
-
76
-
77
-
78
-
79
-
80
-
81
-
82
-
83
-
84
-
85
-
86
-
87
-
88
-
89
-
90
-
91
-
92
-
93
-
94
-
95
-
96
-
97
-
98
-
99
-
100
-
101
-
102
-
103
-
 104
104 -
 105
105 -
 106
106 -
 107
107 -
 108
108 -
 109
109 -
 110
110 -
 111
111 -
 112
112 -
 113
113 -
 114
114 -
 115
115 -
 116
116 -
 117
117 -
 118
118 -
 119
119 -
 120
120 -
 121
121 -
 122
122 -
 123
123 -
 124
124 -
125
-
126
-
127
-
128
-
129
-
130
-
131
-
132
-
133
-
134
-
135
-
136
-
137
-
138
-
139
-
140
-
141
-
142
-
143
-
144
-
145
-
146
-
147
-
148
-
149
-
150
-
151
-
152
-
153
-
154
-
155
-
156
-
157
-
158
-
159
-
160
-
161
-
162
-
163
-
164
-
165
-
166
-
167
-
168
-
169
-
170
-
171
-
172
-
173
-
174
-
175
-
176
-
177
-
178
-
179
-
180
-
181
-
182
-
183
-
184
 |
 |

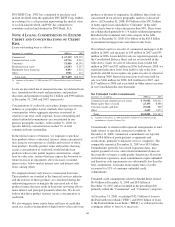
The fair value of securities accepted as collateral that we are
permitted by contract or custom to sell or repledge was $1.6
billion at December 31, 2008 and $2.3 billion at December 31,
2007 and is a component of federal funds sold and resale
agreements on our Consolidated Balance Sheet. Of the
permitted amount, $461 million was repledged to others at
December 31, 2008 and $1.5 billion was repledged to others at
December 31, 2007.
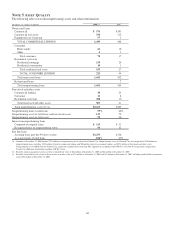
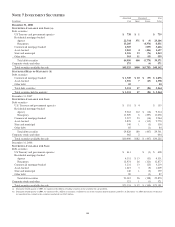
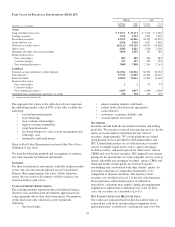
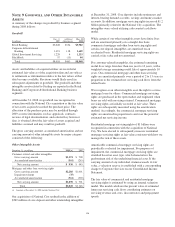
The following table presents, by remaining contractual maturity, the amortized cost, fair value and weighted-average yield of debt
securities at December 31, 2008.
Contractual Maturity Of Debt Securities
December 31, 2008
Dollars in millions
1 Year or
Less
After 1 Year
through 5
Years
After 5 Years
through 10 Years
After 10
Years Total
S
ECURITIES
A
VAILABLE
F
OR
S
ALE
US Treasury and government agencies $ 83 $ 84 $ 552 $ 19 $ 738
Residential mortgage-backed 758 9,890 1,397 23,904 35,949
Commercial mortgage-backed 37 52 4,217 4,306
Asset-backed 22 92 488 1,467 2,069
State and municipal 100 226 186 813 1,325
Other debt 7 464 59 33 563
Total debt securities available for sale $ 970 $10,793 $2,734 $30,453 $44,950
Fair value $ 971 $10,789 $2,702 $25,109 $39,571
Weighted-average yield, GAAP basis 6.09% 5.02% 6.06% 5.53% 5.45%
S
ECURITIES
H
ELD TO
M
ATURITY
Commercial mortgage-backed $ 130 $ 66 $ 1,749 $ 1,945
Asset-backed $ 43 789 395 149 1,376
Other debt 1910
Total debt securities held to maturity $ 43 $ 919 $ 462 $ 1,907 $ 3,331
Fair value $ 42 $ 907 $ 455 $ 1,860 $ 3,264
Weighted-average yield, GAAP basis 5.35% 5.00% 4.27% 5.20% 5.02%
Based on current interest rates and expected prepayment speeds, the total weighted-average expected maturity of mortgage-backed
securities was 2 years and 9 months, of commercial mortgage-backed securities was 4 years and 5 months and of asset-backed
securities was 4 years and 11 months at December 31, 2008. Weighted-average yields are based on historical cost with effective
yields weighted for the contractual maturity of each security. At December 31, 2008, there were no securities of a single issuer,
other than Fannie Mae and Freddie Mac, which exceeded 10% of total shareholders’ equity.
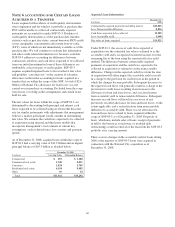
N
OTE
8F
AIR
V
ALUE
Fair Value Measurement
SFAS 157 defines fair value as the price that would be
received to sell an asset or the price paid to transfer a liability
on the measurement date. The standard focuses on the exit
price in the principal or most advantageous market for the
asset or liability in an orderly transaction between willing
market participants.
SFAS 157 establishes a fair value reporting hierarchy to
maximize the use of observable inputs when measuring fair
value and defines the three levels of inputs as noted below.
The financial instruments in Level 3 are typically less liquid.
Level 1
Quoted prices in active markets for identical assets or
liabilities. Level 1 assets and liabilities may include debt
securities, equity securities and listed derivative contracts that
are traded in an active exchange market and certain US
Government and agency-backed securities that are actively
traded in over-the-counter markets.
Level 2
Observable inputs other than Level 1 such as: quoted prices
for similar assets or liabilities in active markets, quoted prices
for identical or similar assets or liabilities in markets that are
not active, or other inputs that are observable or can be
corroborated to observable market data for substantially the
full term of the asset or liability. Level 2 assets and liabilities
may include debt securities, equity securities and listed
derivative contracts with quoted prices that are traded in
markets that are not active, and certain debt and equity
securities and over-the-counter derivative contracts whose fair
value is determined using a pricing model without significant
unobservable inputs. This category generally includes certain
mortgage-backed debt securities, private-issuer securities,
other asset-backed securities, corporate debt securities and
derivative contracts.
110