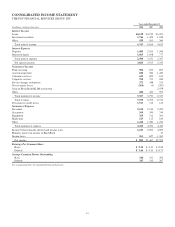
PNC Bank 2008 Annual Report Download - page 75
Download and view the complete annual report
Please find page 75 of the 2008 PNC Bank annual report below. You can navigate through the pages in the report by either clicking on the pages listed below, or by using the keyword search tool below to find specific information within the annual report.-
 1
1 -
2
-
3
-
4
-
5
-
6
-
7
-
8
-
9
-
10
-
11
-
12
-
13
-
14
-
15
-
16
-
17
-
18
-
19
-
20
-
21
-
22
-
23
-
24
-
25
-
26
-
27
-
28
-
29
-
30
-
31
-
32
-
33
-
34
-
35
-
36
-
37
-
38
-
39
-
40
-
41
-
42
-
43
-
44
-
45
-
46
-
47
-
48
-
49
-
50
-
51
-
52
-
53
-
54
-
55
-
56
-
57
-
58
-
59
-
60
-
61
-
62
-
63
-
64
-
 65
65 -
 66
66 -
 67
67 -
 68
68 -
 69
69 -
 70
70 -
 71
71 -
 72
72 -
 73
73 -
 74
74 -
 75
75 -
 76
76 -
 77
77 -
 78
78 -
 79
79 -
 80
80 -
 81
81 -
 82
82 -
 83
83 -
 84
84 -
 85
85 -
86
-
87
-
88
-
89
-
90
-
91
-
92
-
93
-
94
-
95
-
96
-
97
-
98
-
99
-
100
-
101
-
102
-
103
-
104
-
105
-
106
-
107
-
108
-
109
-
110
-
111
-
112
-
113
-
114
-
115
-
116
-
117
-
118
-
119
-
120
-
121
-
122
-
123
-
124
-
125
-
126
-
127
-
128
-
129
-
130
-
131
-
132
-
133
-
134
-
135
-
136
-
137
-
138
-
139
-
140
-
141
-
142
-
143
-
144
-
145
-
146
-
147
-
148
-
149
-
150
-
151
-
152
-
153
-
154
-
155
-
156
-
157
-
158
-
159
-
160
-
161
-
162
-
163
-
164
-
165
-
166
-
167
-
168
-
169
-
170
-
171
-
172
-
173
-
174
-
175
-
176
-
177
-
178
-
179
-
180
-
181
-
182
-
183
-
184
 |
 |
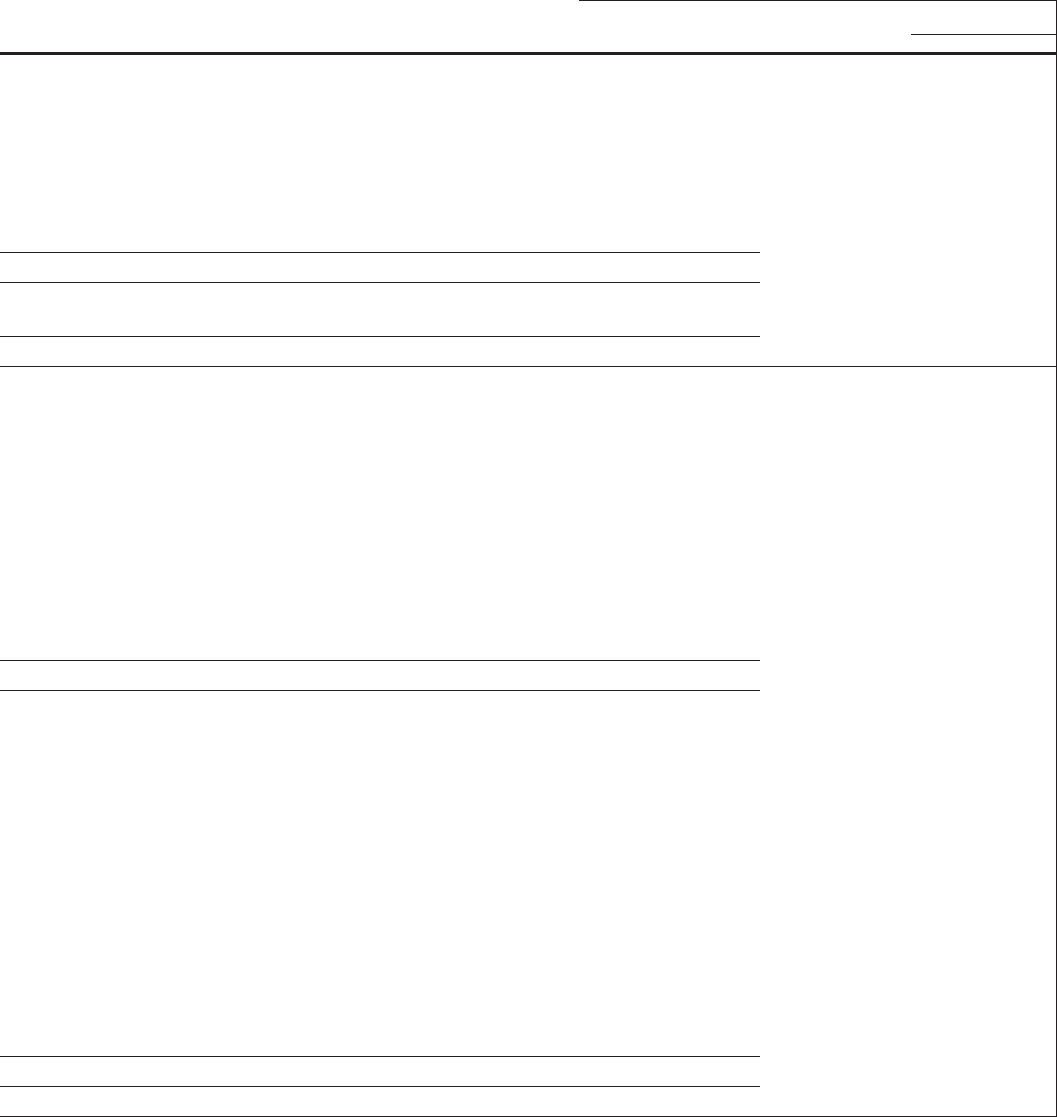
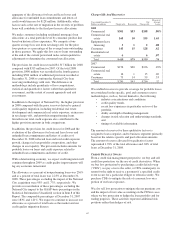
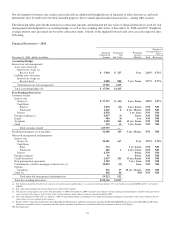
Financial Derivatives – 2007
December 31, 2007- dollars in millions
Notional/
Contractual
Amount
Estimated
Net
Fair Value
Weighted
Average
Maturity
Weighted-Average
Interest Rates
Paid Received
Accounting Hedges
Interest rate risk management
Asset rate conversion
Interest rate swaps (a)
Receive fixed $ 7,856 $ 325 4 yrs. 2 mos. 4.28% 5.34%
Liability rate conversion
Interest rate swaps (a)
Receive fixed 9,440 269 4 yrs. 10 mos. 4.12% 5.09%
Total interest rate risk management 17,296 594
Commercial mortgage banking risk management
Pay fixed interest rate swaps (a) 1,128 (79) 8 yrs. 8 mos. 5.45% 4.52%
Total accounting hedges (b) $ 18,424 $ 515
Free-Standing Derivatives
Customer-related
Interest rate
Swaps $ 61,768 $ (39) 5 yrs. 4 mos. 4.46% 4.49%
Caps/floors
Sold 2,837 (5) 6 yrs. 5 mos. NM NM
Purchased 2,356 7 3 yrs. 7 mos. NM NM
Futures 5,564 8 mos. NM NM
Foreign exchange 7,028 8 7 mos. NM NM
Equity 1,824 (69) 1 yr. 5 mos. NM NM
Swaptions 3,490 40 13 yrs. 10 mos. NM NM
Other 200 10 yrs. 6 mos. NM NM
Total customer-related 85,067 (58)
Other risk management and proprietary
Interest rate
Swaps 41,247 6 4 yrs. 5 mos. 4.44% 4.47%
Caps/floors
Sold 6,250 (82) 2 yrs. 1 mo. NM NM
Purchased 7,760 117 1 yr. 11 mos. NM NM
Futures 43,107 1 yr. 7 mos. NM NM
Foreign exchange 8,713 5 6 yrs. 8 mos. NM NM
Credit derivatives 5,823 42 12 yrs. 1 mo. NM NM
Risk participation agreements 1,183 4 yrs. 6 mos. NM NM
Commitments related to mortgage-related assets 3,190 10 4 mos. NM NM
Options
Futures 39,158 (2) 8 mos. NM NM
Swaptions 21,800 49 8 yrs. 1 mo. NM NM
Other (c) 442 (201) NM NM NM
Total other risk management and proprietary 178,673 (56)
Total free-standing derivatives $263,740 $ (114)
(a) The floating rate portion of interest rate contracts is based on money-market indices. As a percent of a notional amount, 52% were based on 1-month LIBOR, 43% on 3-month LIBOR
and 5% on Prime Rate.
(b) Fair value amounts include net accrued interest receivable of $130 million.
(c) See (e) on page 70.
NM Not meaningful
71