PNC Bank 2008 Annual Report Download - page 54
Download and view the complete annual report
Please find page 54 of the 2008 PNC Bank annual report below. You can navigate through the pages in the report by either clicking on the pages listed below, or by using the keyword search tool below to find specific information within the annual report.-
 1
1 -
2
-
3
-
4
-
5
-
6
-
7
-
8
-
9
-
10
-
11
-
12
-
13
-
14
-
15
-
16
-
17
-
18
-
19
-
20
-
21
-
22
-
23
-
24
-
25
-
26
-
27
-
28
-
29
-
30
-
31
-
32
-
33
-
34
-
35
-
36
-
37
-
38
-
39
-
40
-
41
-
42
-
43
-
 44
44 -
 45
45 -
 46
46 -
 47
47 -
 48
48 -
 49
49 -
 50
50 -
 51
51 -
 52
52 -
 53
53 -
 54
54 -
 55
55 -
 56
56 -
 57
57 -
 58
58 -
 59
59 -
 60
60 -
 61
61 -
 62
62 -
 63
63 -
 64
64 -
65
-
66
-
67
-
68
-
69
-
70
-
71
-
72
-
73
-
74
-
75
-
76
-
77
-
78
-
79
-
80
-
81
-
82
-
83
-
84
-
85
-
86
-
87
-
88
-
89
-
90
-
91
-
92
-
93
-
94
-
95
-
96
-
97
-
98
-
99
-
100
-
101
-
102
-
103
-
104
-
105
-
106
-
107
-
108
-
109
-
110
-
111
-
112
-
113
-
114
-
115
-
116
-
117
-
118
-
119
-
120
-
121
-
122
-
123
-
124
-
125
-
126
-
127
-
128
-
129
-
130
-
131
-
132
-
133
-
134
-
135
-
136
-
137
-
138
-
139
-
140
-
141
-
142
-
143
-
144
-
145
-
146
-
147
-
148
-
149
-
150
-
151
-
152
-
153
-
154
-
155
-
156
-
157
-
158
-
159
-
160
-
161
-
162
-
163
-
164
-
165
-
166
-
167
-
168
-
169
-
170
-
171
-
172
-
173
-
174
-
175
-
176
-
177
-
178
-
179
-
180
-
181
-
182
-
183
-
184
 |
 |

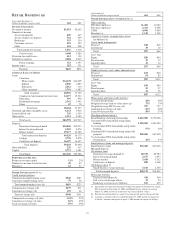
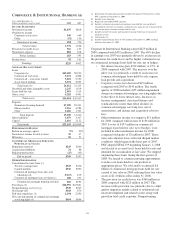
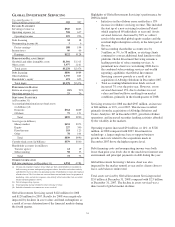
C
ORPORATE
&I
NSTITUTIONAL
B
ANKING
(a)
Year ended December 31
Dollars in millions except as noted 2008 2007
I
NCOME
S
TATEMENT
Net interest income $1,037 $818
Noninterest income
Corporate service fees 545 564
Other (51) 156
Noninterest income 494 720
Total revenue 1,531 1,538
Provision for credit losses 366 125
Noninterest expense 882 818
Pretax earnings 283 595
Income taxes 58 163
Earnings $225 $432
A
VERAGE
B
ALANCE
S
HEET
Loans
Corporate (b) $12,485 $9,930
Commercial real estate 5,631 4,408
Commercial – real estate related 3,022 2,390
Asset-based lending 5,274 4,595
Total loans (b) 26,412 21,323
Goodwill and other intangible assets 2,247 1,919
Loans held for sale 2,053 1,319
Other assets 6,282 4,491
Total assets $36,994 $29,052
Deposits
Noninterest-bearing demand $7,598 $7,301
Money market 5,216 4,784
Other 2,286 1,325
Total deposits 15,100 13,410
Other liabilities 5,479 3,347
Capital 2,616 2,152
Total funds $23,195 $18,909
P
ERFORMANCE
R
ATIOS
Return on average capital 9% 20%
Noninterest income to total revenue 32 47
Efficiency 58 53
C
OMMERCIAL
M
ORTGAGE
S
ERVICING
P
ORTFOLIO
(in billions)
Beginning of period $243 $200
Acquisitions/additions 31 88
Repayments/transfers (25) (45)
End of period $249 $243
O
THER
I
NFORMATION
Consolidated revenue from (c):
Treasury management $545 $476
Capital markets $336 $290
Commercial mortgage loan sales and
valuations (d) $(115) $19
Commercial mortgage loan servicing (e) 180 233
Commercial mortgage banking activities $65 $252
Total loans (f) $28,996 $23,861
Nonperforming assets (f) (g) $749 $243
Net charge-offs $168 $70
Full-time employees (f) 2,294 2,290
Net carrying amount of commercial mortgage
servicing rights (f) $654 $694
(a) Information for all periods presented excludes the impact of National City, which
PNC acquired on December 31, 2008.
(b) Includes lease financing.
(c) Represents consolidated PNC amounts.
(d) Includes valuations on commercial mortgage loans held for sale and related
commitments, derivative valuations, origination fees, gains on sale of loans held for
sale and net interest income on loans held for sale.
(e) Includes net interest income and noninterest income from loan servicing and
ancillary services.
(f) At December 31.
(g) Includes nonperforming loans of $747 million at December 31, 2008 and $222
million at December 31, 2007.
Corporate & Institutional Banking earned $225 million in
2008 compared with $432 million in 2007. The 48% decline
in earnings over 2007 was primarily driven by an increase in
the provision for credit losses and by higher valuation losses
on commercial mortgage loans held for sale, net of hedges.
• Net interest income grew $219 million, or 27%, in
2008 compared with 2007. The increase over the
prior year was primarily a result of an increase in
commercial mortgage loans held for sale, organic
loan growth and acquisitions.
• Corporate service fees decreased $19 million
compared with 2007 to $545 million. The fourth
quarter of 2008 included a $35 million impairment
charge on commercial mortgage servicing rights due
to the effect of lower interest rates. Increases in
treasury management, structured finance and
syndication fees more than offset declines in
commercial mortgage servicing fees, net of
amortization, and merger and acquisition advisory
fees.
• Other noninterest income was negative $51 million
for 2008 compared with income of $156 million in
2007. Losses of $197 million on commercial
mortgage loans held for sale, net of hedges, were
included in other noninterest income for 2008
compared with gains of $3 million in 2007. These
non-cash valuation losses reflected illiquid market
conditions which began in the latter part of 2007.
• PNC adopted SFAS 159 beginning January 1, 2008
and elected to account for its loans held for sale and
intended for securitization at fair value. We stopped
originating these loans during the first quarter of
2008. We intend to continue pursuing opportunities
to reduce our loans held for sale position at
appropriate prices. We sold and/or securitized $.6
billion of commercial mortgage loans held for sale
carried at fair value in 2008 reducing these fair value
assets to $1.4 billion at December 31, 2008.
• The provision for credit losses was $366 million in
2008 compared with $125 million in 2007. The
increase in the provision was primarily due to credit
quality migration mainly related to residential real
estate development and related sectors along with
growth in total credit exposure. Nonperforming
50