PNC Bank 2008 Annual Report Download - page 69
Download and view the complete annual report
Please find page 69 of the 2008 PNC Bank annual report below. You can navigate through the pages in the report by either clicking on the pages listed below, or by using the keyword search tool below to find specific information within the annual report.-
 1
1 -
2
-
3
-
4
-
5
-
6
-
7
-
8
-
9
-
10
-
11
-
12
-
13
-
14
-
15
-
16
-
17
-
18
-
19
-
20
-
21
-
22
-
23
-
24
-
25
-
26
-
27
-
28
-
29
-
30
-
31
-
32
-
33
-
34
-
35
-
36
-
37
-
38
-
39
-
40
-
41
-
42
-
43
-
44
-
45
-
46
-
47
-
48
-
49
-
50
-
51
-
52
-
53
-
54
-
55
-
56
-
57
-
58
-
 59
59 -
 60
60 -
 61
61 -
 62
62 -
 63
63 -
 64
64 -
 65
65 -
 66
66 -
 67
67 -
 68
68 -
 69
69 -
 70
70 -
 71
71 -
 72
72 -
 73
73 -
 74
74 -
 75
75 -
 76
76 -
 77
77 -
 78
78 -
 79
79 -
80
-
81
-
82
-
83
-
84
-
85
-
86
-
87
-
88
-
89
-
90
-
91
-
92
-
93
-
94
-
95
-
96
-
97
-
98
-
99
-
100
-
101
-
102
-
103
-
104
-
105
-
106
-
107
-
108
-
109
-
110
-
111
-
112
-
113
-
114
-
115
-
116
-
117
-
118
-
119
-
120
-
121
-
122
-
123
-
124
-
125
-
126
-
127
-
128
-
129
-
130
-
131
-
132
-
133
-
134
-
135
-
136
-
137
-
138
-
139
-
140
-
141
-
142
-
143
-
144
-
145
-
146
-
147
-
148
-
149
-
150
-
151
-
152
-
153
-
154
-
155
-
156
-
157
-
158
-
159
-
160
-
161
-
162
-
163
-
164
-
165
-
166
-
167
-
168
-
169
-
170
-
171
-
172
-
173
-
174
-
175
-
176
-
177
-
178
-
179
-
180
-
181
-
182
-
183
-
184
 |
 |

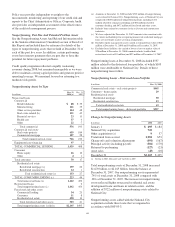
In addition to dividends from PNC Bank, N.A., other sources
of parent company liquidity include cash and short-term
investments, as well as dividends and loan repayments from
other subsidiaries and dividends or distributions from equity
investments. As of December 31, 2008, the parent company
had approximately $4.2 billion in funds available from its cash
and short-term investments.
We can also generate liquidity for the parent company and
PNC’s non-bank subsidiaries through the issuance of
securities in public or private markets.
In December 2008, PNC Funding Corp issued the following
securities totaling $2.9 billion under the FDIC’s Temporary
Liquidity Guarantee Program-Debt Guarantee Program:
• $2 billion of fixed rate senior notes due June 2012.
These notes pay interest semiannually at a fixed rate
of 2.3%.
• $500 million of fixed rate senior notes due June
2011. These notes pay interest semiannually at a
fixed rate of 1.875%.
• $400 million of floating rate senior notes due June
2011. Interest will be reset quarterly to 3-month
LIBOR plus 28 basis points and interest will be paid
quarterly.
Each of these series of senior notes is guaranteed by the parent
company and by the FDIC and is backed by the full faith and
credit of the United States through June 30, 2012.
See the Executive Summary section of this Financial Review
and Note 19 Shareholders’ Equity in the Notes To
Consolidated Financial Statements in Item 8 of this Report for
information regarding PNC’s December 31, 2008 issuance of
$7.6 billion of preferred stock and related common stock
warrant to the US Treasury under the TARP Capital Purchase
Program.
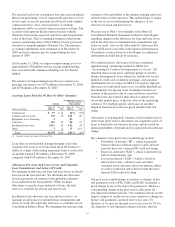
PNC Funding Corp has the ability to offer up to $3.0 billion of
commercial paper to provide the parent company with
additional liquidity. As of December 31, 2008, $99 million of
commercial paper was outstanding under this program.
We have effective shelf registration statements which enable
us to issue additional debt and equity securities, including
certain hybrid capital instruments. As of December 31, 2008,
there were $1.4 billion of parent company contractual
obligations, including commercial paper, with maturities of
less than one year.
We also provide tables showing contractual obligations and
various other commitments representing required and
potential cash outflows as of December 31, 2008 under the
heading “Commitments” below.
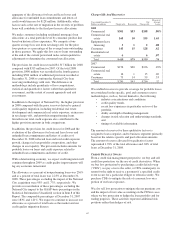
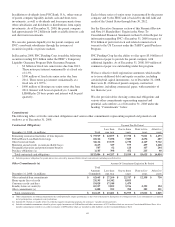
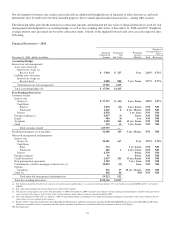
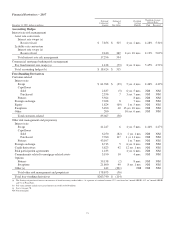
Commitments
The following tables set forth contractual obligations and various other commitments representing required and potential cash
outflows as of December 31, 2008.
Contractual Obligations Payment Due By Period
December 31, 2008 - in millions Total
Less than
one year
One to three
years
Four to five
years
After five
years
Remaining contractual maturities of time deposits $ 75,919 $ 44,877 $ 17,758 $ 9,011 $ 4,273
Federal Home Loan Bank borrowings 18,126 5,058 7,887 4,694 487
Other borrowed funds 34,114 13,533 6,730 4,129 9,722
Minimum annual rentals on noncancellable leases 2,615 329 579 459 1,248
Nonqualified pension and postretirement benefits 567 62 124 117 264
Purchase obligations (a) 1,145 398 472 215 60
Total contractual cash obligations $132,486 $ 64,257 $ 33,550 $ 18,625 $ 16,054
(a) Includes purchase obligations for goods and services covered by noncancellable contracts and contracts including cancellation fees.
Other Commitments (a) Amount Of Commitment Expiration By Period
December 31, 2008 - in millions
Total
Amounts
Committed
Less than
one year
One to three
years
Four to five
years
After five
years
Other unfunded loan commitments $ 62,665 $ 27,260 $ 22,317 $ 12,358 $ 730
Home equity lines of credit 23,195 14,342 8,853
Consumer credit card lines 19,028 17,549 1,479
Standby letters of credit (b) 10,317 3,855 3,916 2,352 194
Other commitments (c) 1,408 595 390 302 121
Total commitments $ 116,613 $ 63,601 $ 36,955 $ 15,012 $ 1,045
(a) Other commitments are funding commitments that could potentially require performance in the event of demands by third parties or contingent events. Loan commitments are reported
net of participations, assignments and syndications.
(b) Includes $5.1 billion of standby letters of credit that support remarketing programs for customers’ variable rate demand notes.
(c) Includes unfunded commitments related to private equity investments of $540 million and other investments of $178 million which are not on our Consolidated Balance Sheet. Also
includes commitments related to tax credit investments of $690 million which are included in other liabilities on the Consolidated Balance Sheet.
65