PNC Bank 2008 Annual Report Download - page 50
Download and view the complete annual report
Please find page 50 of the 2008 PNC Bank annual report below. You can navigate through the pages in the report by either clicking on the pages listed below, or by using the keyword search tool below to find specific information within the annual report.-
 1
1 -
2
-
3
-
4
-
5
-
6
-
7
-
8
-
9
-
10
-
11
-
12
-
13
-
14
-
15
-
16
-
17
-
18
-
19
-
20
-
21
-
22
-
23
-
24
-
25
-
26
-
27
-
28
-
29
-
30
-
31
-
32
-
33
-
34
-
35
-
36
-
37
-
38
-
39
-
 40
40 -
 41
41 -
 42
42 -
 43
43 -
 44
44 -
 45
45 -
 46
46 -
 47
47 -
 48
48 -
 49
49 -
 50
50 -
 51
51 -
 52
52 -
 53
53 -
 54
54 -
 55
55 -
 56
56 -
 57
57 -
 58
58 -
 59
59 -
 60
60 -
61
-
62
-
63
-
64
-
65
-
66
-
67
-
68
-
69
-
70
-
71
-
72
-
73
-
74
-
75
-
76
-
77
-
78
-
79
-
80
-
81
-
82
-
83
-
84
-
85
-
86
-
87
-
88
-
89
-
90
-
91
-
92
-
93
-
94
-
95
-
96
-
97
-
98
-
99
-
100
-
101
-
102
-
103
-
104
-
105
-
106
-
107
-
108
-
109
-
110
-
111
-
112
-
113
-
114
-
115
-
116
-
117
-
118
-
119
-
120
-
121
-
122
-
123
-
124
-
125
-
126
-
127
-
128
-
129
-
130
-
131
-
132
-
133
-
134
-
135
-
136
-
137
-
138
-
139
-
140
-
141
-
142
-
143
-
144
-
145
-
146
-
147
-
148
-
149
-
150
-
151
-
152
-
153
-
154
-
155
-
156
-
157
-
158
-
159
-
160
-
161
-
162
-
163
-
164
-
165
-
166
-
167
-
168
-
169
-
170
-
171
-
172
-
173
-
174
-
175
-
176
-
177
-
178
-
179
-
180
-
181
-
182
-
183
-
184
 |
 |

Total business segment financial results differ from total
consolidated results. The impact of these differences is
reflected in the “Other” category. “Other” for purposes of this
Business Segments Review and the Business Segment
Highlights in the Executive Summary includes residual
activities that do not meet the criteria for disclosure as a
separate reportable business, such as gains or losses related to
BlackRock transactions including LTIP share distributions
and obligations, earnings and gains or losses related to
Hilliard Lyons, integration costs, asset and liability
management activities including net securities gains or losses
and certain trading activities, equity management activities,
differences between business segment performance reporting
and financial statement reporting (GAAP), intercompany
eliminations, and most corporate overhead.
Employee data as reported by each business segment in the
tables that follow reflect PNC legacy staff directly employed
by the respective businesses and excludes corporate and
shared services employees. National City legacy employees
totaling 31,374 at December 31, 2008 are not included in any
of PNC’s business segment tables.
Beginning in the first quarter of 2009, PNC expects to have
three new reportable business segments which are described in
Note 28 Subsequent Event included in the Notes To
Consolidated Financial Statements under Item 8 of this
Report.
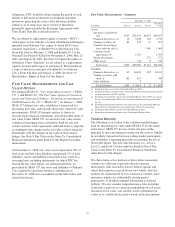
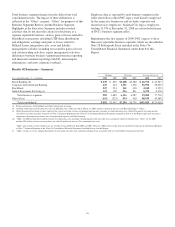
Results Of Businesses – Summary
Year ended December 31 - in millions
Earnings Revenue Average Assets (a)
2008 2007 2008 2007 2008 2007
Retail Banking (b) $ 429 $ 876 $3,608 $3,580 $ 46,578 $ 41,943
Corporate & Institutional Banking 225 432 1,531 1,538 36,994 29,052
BlackRock 207 253 261 338 4,240 4,259
Global Investment Servicing (c) 122 128 916 831 5,278 2,476
Total business segments 983 1,689 6,316 6,287 93,090 77,730
Other (d) (e) (101) (222) 874 418 48,930 45,688
Total consolidated $ 882 $1,467 $7,190 $6,705 $142,020 $123,418
(a) Period-end balances for BlackRock and Global Investment Servicing.
(b) Amounts reflect the reclassification of results for Hilliard Lyons, which we sold on March 31, 2008, and the related gain on sale, from Retail Banking to “Other.”
(c) Global Investment Servicing revenue represents the sum of servicing revenue and nonoperating income (expense) less debt financing costs. Global Investment Servicing income
classified as net interest income (expense) in Note 27 Segment Reporting in the Notes To Consolidated Financial Statements included in Item 8 of this Report represents the interest
components of nonoperating income (net of nonoperating expense) and debt financing.
(d) “Other” for 2008 includes $422 million of after-tax integration costs, including conforming provision for credit losses, primarily related to National City. “Other” for the 2007
includes $99 million of after-tax integration costs and $53 million of after-tax Visa indemnification costs.
“Other” also includes results related to our cross-border lease portfolio for both 2008 and 2007. However, 2006 results for this item are included in Corporate & Institutional Banking
in Note 27 Segment Reporting in the Notes To Consolidated Financial Statements included in Item 8 of this Report.
(e) “Other” average assets are comprised primarily of investment securities and residential mortgage loans associated with asset and liability management activities.
46