PNC Bank 2008 Annual Report Download - page 113
Download and view the complete annual report
Please find page 113 of the 2008 PNC Bank annual report below. You can navigate through the pages in the report by either clicking on the pages listed below, or by using the keyword search tool below to find specific information within the annual report.-
 1
1 -
2
-
3
-
4
-
5
-
6
-
7
-
8
-
9
-
10
-
11
-
12
-
13
-
14
-
15
-
16
-
17
-
18
-
19
-
20
-
21
-
22
-
23
-
24
-
25
-
26
-
27
-
28
-
29
-
30
-
31
-
32
-
33
-
34
-
35
-
36
-
37
-
38
-
39
-
40
-
41
-
42
-
43
-
44
-
45
-
46
-
47
-
48
-
49
-
50
-
51
-
52
-
53
-
54
-
55
-
56
-
57
-
58
-
59
-
60
-
61
-
62
-
63
-
64
-
65
-
66
-
67
-
68
-
69
-
70
-
71
-
72
-
73
-
74
-
75
-
76
-
77
-
78
-
79
-
80
-
81
-
82
-
83
-
84
-
85
-
86
-
87
-
88
-
89
-
90
-
91
-
92
-
93
-
94
-
95
-
96
-
97
-
98
-
99
-
100
-
101
-
102
-
 103
103 -
 104
104 -
 105
105 -
 106
106 -
 107
107 -
 108
108 -
 109
109 -
 110
110 -
 111
111 -
 112
112 -
 113
113 -
 114
114 -
 115
115 -
 116
116 -
 117
117 -
 118
118 -
 119
119 -
 120
120 -
 121
121 -
 122
122 -
 123
123 -
124
-
125
-
126
-
127
-
128
-
129
-
130
-
131
-
132
-
133
-
134
-
135
-
136
-
137
-
138
-
139
-
140
-
141
-
142
-
143
-
144
-
145
-
146
-
147
-
148
-
149
-
150
-
151
-
152
-
153
-
154
-
155
-
156
-
157
-
158
-
159
-
160
-
161
-
162
-
163
-
164
-
165
-
166
-
167
-
168
-
169
-
170
-
171
-
172
-
173
-
174
-
175
-
176
-
177
-
178
-
179
-
180
-
181
-
182
-
183
-
184
 |
 |

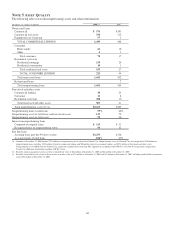
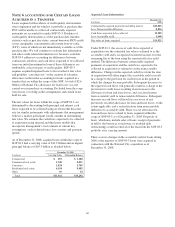
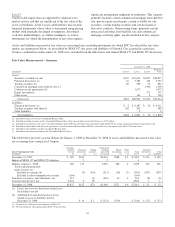
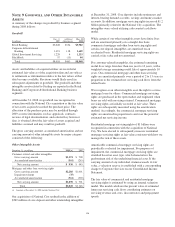
The fair value of investment securities is impacted by interest rates, credit spreads, market volatility and illiquidity. Net unrealized
gains and losses in the securities available for sale portfolio are included in shareholders’ equity as accumulated other
comprehensive income or loss, net of tax.
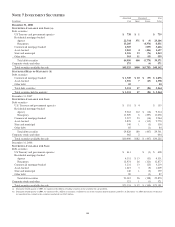
The following table presents unrealized loss and fair value of investment securities at December 31, 2008 and December 31, 2007
for which an other-than-temporary impairment has not been recognized. These securities are segregated between investments that
have been in a continuous unrealized loss position for less than twelve months and twelve months or more.
Unrealized loss
position less than
12 months
Unrealized loss
position 12 months
or more Total
In millions
Unrealized
Loss
Fair
Value
Unrealized
Loss
Fair
Value
Unrealized
Loss
Fair
Value
December 31, 2008
Securities available for sale
Debt securities
Residential mortgage-backed $(1,775) $3,619 ($ 2,608) $3,871 ($ 4,383) $ 7,490
Commercial mortgage-backed (482) 2,207 (377) 1,184 (859) 3,391
Asset-backed (102) 523 (344) 887 (446) 1,410
State and municipal (56) 370 (20) 26 (76) 396
Other debt (11) 185 (4) 8 (15) 193
Total $(2,426) $6,904 $ (3,353) $5,976 $ (5,779) $12,880
December 31, 2007
Securities available for sale
Debt securities
Residential mortgage-backed $ (157) $6,994 $ (156) $5,065 $ (313) $12,059
Commercial mortgage-backed (3) 365 (13) 769 (16) 1,134
Asset-backed (87) 1,519 (25) 655 (112) 2,174
State and municipal (4) 79 (1) 82 (5) 161
Other debt (1) 40 3 (1) 43
Total $ (252) $8,997 $ (195) $6,574 $ (447) $15,571
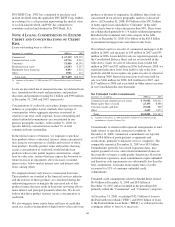
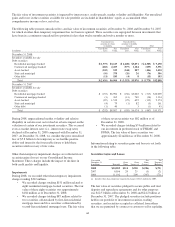
During 2008, unprecedented market volatility and relative
illiquidity in certain asset sectors had an adverse impact on the
valuation of certain of our investment securities. This occurred
even as market interest rates (i.e., interest rate swap rates)
declined at December 31, 2008 compared with December 31,
2007. At December 31, 2008, we consider the gross unrealized
loss of $5.8 billion to be temporary as we had the positive
ability and intent for the foreseeable future to hold these
securities until recovery of fair value.
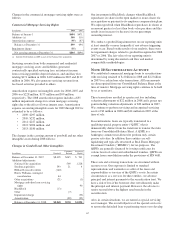
Other-than-temporary impairment charges are reflected in net
securities gains (losses) on our Consolidated Income
Statement. These charges include the impact of declines in
both credit quality and liquidity.
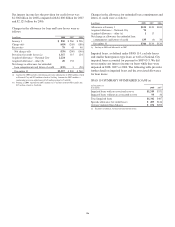
Impairments
During 2008, we recorded other-than-temporary impairment
charges totaling $312 million.
• We recorded charges totaling $151 million related to
eight residential mortgage-backed securities. The fair
value of these eight securities was approximately
$184 million as of December 31, 2008.
• We recorded charges totaling $87 million related to
two securities collateralized by first-lien residential
mortgage loans and five securities collateralized by
second-lien residential mortgage loans. The fair value
of these seven securities was $82 million as of
December 31, 2008.
• We recorded charges totaling $74 million related to
our investment in preferred stock of FHLMC and
FNMA. The fair value of these securities was
approximately $2 million as of December 31, 2008.
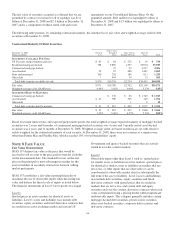
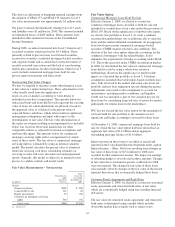
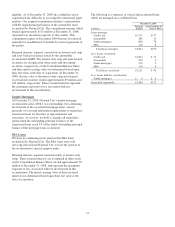
Information relating to securities gains and losses is set forth
in the following table.
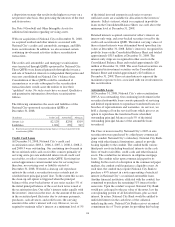
Securities Gains and Losses
Year ended
December 31
In millions Proceeds
Gross
Gains
Gross
Losses (a)
Net
Gains
(Losses)
Tax
Expense
(Benefit)
2008 $10,283 $114 $320 $(206) $(72)
2007 6,056 20 25 (5) (2)
2006 11,102 2 209 (207) (72)
(a) Includes other-than-temporary impairment charges of $312 million for 2008.
The fair value of securities pledged to secure public and trust
deposits and repurchase agreements and for other purposes
was $22.5 billion at December 31, 2008 and $24.2 billion at
December 31, 2007. The pledged securities include positions
held in our portfolio of investment securities, trading
securities, and securities accepted as collateral from others
that we are permitted by contract or custom to sell or repledge.
109