PNC Bank 2008 Annual Report Download - page 51
Download and view the complete annual report
Please find page 51 of the 2008 PNC Bank annual report below. You can navigate through the pages in the report by either clicking on the pages listed below, or by using the keyword search tool below to find specific information within the annual report.-
 1
1 -
2
-
3
-
4
-
5
-
6
-
7
-
8
-
9
-
10
-
11
-
12
-
13
-
14
-
15
-
16
-
17
-
18
-
19
-
20
-
21
-
22
-
23
-
24
-
25
-
26
-
27
-
28
-
29
-
30
-
31
-
32
-
33
-
34
-
35
-
36
-
37
-
38
-
39
-
40
-
 41
41 -
 42
42 -
 43
43 -
 44
44 -
 45
45 -
 46
46 -
 47
47 -
 48
48 -
 49
49 -
 50
50 -
 51
51 -
 52
52 -
 53
53 -
 54
54 -
 55
55 -
 56
56 -
 57
57 -
 58
58 -
 59
59 -
 60
60 -
 61
61 -
62
-
63
-
64
-
65
-
66
-
67
-
68
-
69
-
70
-
71
-
72
-
73
-
74
-
75
-
76
-
77
-
78
-
79
-
80
-
81
-
82
-
83
-
84
-
85
-
86
-
87
-
88
-
89
-
90
-
91
-
92
-
93
-
94
-
95
-
96
-
97
-
98
-
99
-
100
-
101
-
102
-
103
-
104
-
105
-
106
-
107
-
108
-
109
-
110
-
111
-
112
-
113
-
114
-
115
-
116
-
117
-
118
-
119
-
120
-
121
-
122
-
123
-
124
-
125
-
126
-
127
-
128
-
129
-
130
-
131
-
132
-
133
-
134
-
135
-
136
-
137
-
138
-
139
-
140
-
141
-
142
-
143
-
144
-
145
-
146
-
147
-
148
-
149
-
150
-
151
-
152
-
153
-
154
-
155
-
156
-
157
-
158
-
159
-
160
-
161
-
162
-
163
-
164
-
165
-
166
-
167
-
168
-
169
-
170
-
171
-
172
-
173
-
174
-
175
-
176
-
177
-
178
-
179
-
180
-
181
-
182
-
183
-
184
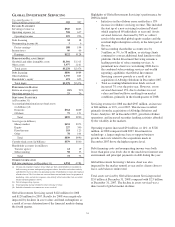
 |
 |

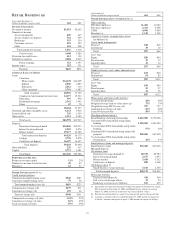
R
ETAIL
B
ANKING
(a)
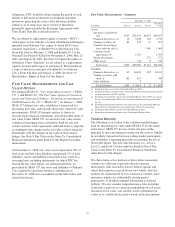
Year ended December 31
Dollars in millions except as noted 2008 2007
I
NCOME
S
TATEMENT
Net interest income $1,992 $2,062
Noninterest income
Asset management 420 445
Service charges on deposits 362 339
Brokerage 153 134
Consumer services 419 392
Other 262 208
Total noninterest income 1,616 1,518
Total revenue 3,608 3,580
Provision for credit losses 612 138
Noninterest expense 2,284 2,045
Pretax earnings 712 1,397
Income taxes 283 521
Earnings $429 $876
A
VERAGE
B
ALANCE
S
HEET
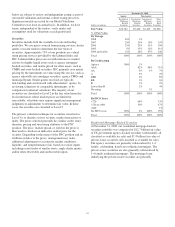
Loans
Consumer
Home equity $14,678 $14,209
Indirect 2,050 1,897
Education 2,012 110
Other consumer 1,761 1,487
Total consumer 20,501 17,703
Commercial and commercial real estate 14,677 12,534
Floor plan 997 978
Residential mortgage 2,362 1,992
Other 67 70
Total loans 38,604 33,277
Goodwill and other intangible assets 6,132 4,920
Loans held for sale 329 1,564
Other assets 1,513 2,182
Total assets $46,578 $41,943
Deposits
Noninterest-bearing demand $10,860 $10,513
Interest-bearing demand 9,583 8,876
Money market 19,677 16,786
Total transaction deposits 40,120 36,175
Savings 2,701 2,678
Certificates of deposit 16,397 16,637
Total deposits 59,218 55,490
Other liabilities 329 417
Capital 3,773 3,481
Total funds $63,320 $59,388
P
ERFORMANCE
R
ATIOS
Return on average capital 11% 25%
Noninterest income to total revenue 45 42
Efficiency 63 57
O
THER
I
NFORMATION
(b) (c)
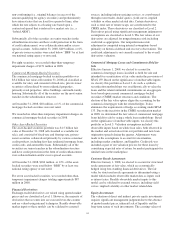
Credit-related statistics:
Commercial nonperforming assets $540 $187
Consumer nonperforming assets 79 38
Total nonperforming assets (d) $619 $225
Commercial net charge-offs $239 $71
Consumer net charge-offs 129 60
Total net charge-offs $368 $131
Commercial net charge-off ratio 1.52% .52%
Consumer net charge-off ratio .56% .30%
Total net charge-off ratio .95% .39%
At December 31
Dollars in millions except as noted 2008 2007
O
THER
I
NFORMATION CONTINUED
(b) (c)
Other statistics:
Full-time employees 11,481 11,022
Part-time employees 2,363 2,298
ATMs 4,041 3,900
Branches (e) 1,148 1,109
ASSETS UNDER ADMINISTRATION
(in billions) (f)
Assets under management
Personal $38 $49
Institutional 19 20
Total $57 $69
Asset Type
Equity $26 $40
Fixed income 19 17
Liquidity/other 12 12
Total $57 $69
Nondiscretionary assets under administration
Personal $23 $30
Institutional 64 82
Total $87 $112
Asset Type
Equity $34 $49
Fixed income 19 27
Liquidity/other 34 36
Total $87 $112
Home equity portfolio credit statistics:
% of first lien positions 38% 39%
Weighted average loan-to-value ratios (g) 73% 73%
Weighted average FICO scores (h) 727 727
Annualized net charge-off ratio .52% .20%
Loans 90 days past due .58% .37%
Checking-related statistics:
Retail Banking checking relationships 2,432,000 2,272,000
Consumer DDA households using online
banking 1,238,000 1,091,000
% of consumer DDA households using online
banking 57% 54%
Consumer DDA households using online bill
payment 882,000 667,000
% of consumer DDA households using online
bill payment 41% 33%
Small business loans and managed deposits:
Small business loans $13,483 $13,049
Managed deposits:
On-balance sheet
Noninterest-bearing demand (i) $8,319 $5,994
Interest-bearing demand 2,157 1,873
Money market 3,638 3,152
Certificates of deposit 880 1,068
Off-balance sheet (j)
Small business sweep checking 3,140 2,780
Total managed deposits $18,134 $14,867
Brokerage statistics:
Financial consultants (k) 414 364
Full service brokerage offices 23 24
Brokerage account assets (billions) $15 $19
(a) Information for all periods presented excludes the impact of National City, which
PNC acquired on December 31, 2008, and Hilliard Lyons, which was sold on
March 31, 2008, and whose results have been reclassified to “Other.”
(b) Presented as of December 31 except for net charge-offs and net charge-off ratio.
(c) Amounts as of and for the year ended December 31, 2008 include the impact of
Yardville. Amounts subsequent to April 4, 2008 include the impact of Sterling.
47