The Hartford 2014 Annual Report Download - page 99
Download and view the complete annual report
Please find page 99 of the 2014 The Hartford annual report below. You can navigate through the pages in the report by either clicking on the pages listed below, or by using the keyword search tool below to find specific information within the annual report.-
 1
1 -
 2
2 -
 3
3 -
 4
4 -
 5
5 -
 6
6 -
 7
7 -
 8
8 -
 9
9 -
 10
10 -
 11
11 -
 12
12 -
 13
13 -
 14
14 -
 15
15 -
 16
16 -
 17
17 -
 18
18 -
 19
19 -
 20
20 -
 21
21 -
 22
22 -
 23
23 -
 24
24 -
 25
25 -
 26
26 -
 27
27 -
 28
28 -
 29
29 -
 30
30 -
 31
31 -
 32
32 -
 33
33 -
 34
34 -
 35
35 -
 36
36 -
 37
37 -
 38
38 -
 39
39 -
 40
40 -
 41
41 -
 42
42 -
 43
43 -
 44
44 -
 45
45 -
 46
46 -
 47
47 -
 48
48 -
 49
49 -
 50
50 -
 51
51 -
 52
52 -
 53
53 -
 54
54 -
 55
55 -
 56
56 -
 57
57 -
 58
58 -
 59
59 -
 60
60 -
 61
61 -
 62
62 -
 63
63 -
 64
64 -
 65
65 -
 66
66 -
 67
67 -
 68
68 -
 69
69 -
 70
70 -
 71
71 -
 72
72 -
 73
73 -
 74
74 -
 75
75 -
 76
76 -
 77
77 -
 78
78 -
 79
79 -
 80
80 -
 81
81 -
 82
82 -
 83
83 -
 84
84 -
 85
85 -
 86
86 -
 87
87 -
 88
88 -
 89
89 -
 90
90 -
 91
91 -
 92
92 -
 93
93 -
 94
94 -
 95
95 -
 96
96 -
 97
97 -
 98
98 -
 99
99 -
 100
100 -
 101
101 -
 102
102 -
 103
103 -
 104
104 -
 105
105 -
 106
106 -
 107
107 -
 108
108 -
 109
109 -
 110
110 -
 111
111 -
 112
112 -
 113
113 -
 114
114 -
 115
115 -
 116
116 -
 117
117 -
 118
118 -
 119
119 -
 120
120 -
 121
121 -
 122
122 -
 123
123 -
 124
124 -
 125
125 -
 126
126 -
 127
127 -
 128
128 -
 129
129 -
 130
130 -
 131
131 -
 132
132 -
 133
133 -
 134
134 -
 135
135 -
 136
136 -
 137
137 -
 138
138 -
 139
139 -
 140
140 -
 141
141 -
 142
142 -
 143
143 -
 144
144 -
 145
145 -
 146
146 -
 147
147 -
 148
148 -
 149
149 -
 150
150 -
 151
151 -
 152
152 -
 153
153 -
 154
154 -
 155
155 -
 156
156 -
 157
157 -
 158
158 -
 159
159 -
 160
160 -
 161
161 -
 162
162 -
 163
163 -
 164
164 -
 165
165 -
 166
166 -
 167
167 -
 168
168 -
 169
169 -
 170
170 -
 171
171 -
 172
172 -
 173
173 -
 174
174 -
 175
175 -
 176
176 -
 177
177 -
 178
178 -
 179
179 -
 180
180 -
 181
181 -
 182
182 -
 183
183 -
 184
184 -
 185
185 -
 186
186 -
 187
187 -
 188
188 -
 189
189 -
 190
190 -
 191
191 -
 192
192 -
 193
193 -
 194
194 -
 195
195 -
 196
196 -
 197
197 -
 198
198 -
 199
199 -
 200
200 -
 201
201 -
 202
202 -
 203
203 -
 204
204 -
 205
205 -
 206
206 -
 207
207 -
 208
208 -
 209
209 -
 210
210 -
 211
211 -
 212
212 -
 213
213 -
 214
214 -
 215
215 -
 216
216 -
 217
217 -
 218
218 -
 219
219 -
 220
220 -
 221
221 -
 222
222 -
 223
223 -
 224
224 -
 225
225 -
 226
226 -
 227
227 -
 228
228 -
 229
229 -
 230
230 -
 231
231 -
 232
232 -
 233
233 -
 234
234 -
 235
235 -
 236
236 -
 237
237 -
 238
238 -
 239
239 -
 240
240 -
 241
241 -
 242
242 -
 243
243 -
 244
244 -
 245
245 -
 246
246 -
 247
247 -
 248
248 -
 249
249 -
 250
250 -
 251
251 -
 252
252 -
 253
253 -
 254
254 -
 255
255 -
 256
256 -
 257
257 -
 258
258 -
 259
259 -
 260
260 -
 261
261 -
 262
262 -
 263
263 -
 264
264 -
 265
265 -
 266
266 -
 267
267 -
 268
268 -
 269
269 -
 270
270 -
 271
271 -
 272
272 -
 273
273 -
 274
274 -
 275
275 -
 276
276 -
 277
277 -
 278
278 -
 279
279 -
 280
280 -
 281
281 -
 282
282 -
 283
283 -
 284
284 -
 285
285 -
 286
286 -
 287
287 -
 288
288 -
 289
289 -
 290
290 -
 291
291 -
 292
292 -
 293
293 -
 294
294 -
 295
295 -
 296
296
 |
 |

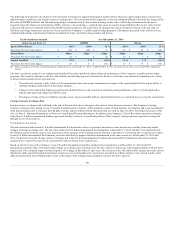
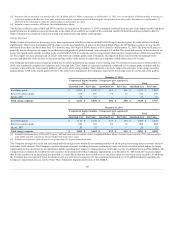
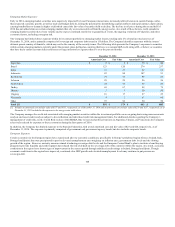
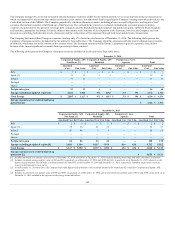
The following tables summarize the account values of the Company’s variable annuities with guarantee features and the NAR split between various
guarantee features (retained net amount at risk does not take into consideration the effects of the variable annuity hedge programs in place as of each balance
sheet date):
($ in billions)
GMDB $ 52.9 $ 3.8 $ 0.8 23% 14%
GMWB 24.8 0.2 0.1 6% 11%
($ in billions)
GMDB $ 61.8 $ 4.3 $ 1.0 16% 26%
GMWB 30.3 0.2 0.1 5% 12%
GMDB 20.1 0.8 0.6 31% 8%
GMIB [5] 18.5 0.1 0.1 20% 3%
[1] Policies with a guaranteed living benefit also have a guaranteed death benefit. The net amount at risk (“NAR”) for each benefit is shown; however these benefits are not
additive. When a policy terminates due to death, any NAR related to GMWB is released. Similarly, when a policy goes into benefit status on a GMWB, its GMDB NAR is
reduced to zero.
[2] Excludes contracts that are fully reinsured.
[3] For all contracts that are “in the money”, this represents the percentage by which the average contract was in the money.
[4] On June 30, 2014, the Company completed the sale of the Japan variable annuity business of HLIKK. For further information of the sale of Japan variable annuity business,
HLIKK in 2014, see Note 2 - Business Dispositions of Notes to the Consolidated Financial Statements.
[5] Includes small amount of GMWB and GMAB.
Many policyholders with a GMDB also have a GMWB. Policyholders that have a product that offer both guarantees can only receive the GMDB or GMWB.
The GMDB NAR disclosed in the tables above is a point in time measurement and assumes that all participants utilize the GMDB benefit on that
measurement date. For additional information on the Company's GMDB liability, see Note 10 - Separate Accounts, Death Benefits and Other Insurance
Benefit Features of Notes to Consolidated Financial Statements.
The Company expects to incur GMDB payments in the future only if the policyholder has an “in the money” GMDB at their death. If the account value is
reduced to a specified level, the contract holder will receive an annuity equal to the guaranteed remaining balance ("GRB"). For the Company’s “life-time”
GMWB products, this annuity can exceed the GRB. As the account value fluctuates with equity market returns on a daily basis and the “life-time” GMWB
payments may exceed the GRB, the ultimate amount to be paid by the Company, if any, is uncertain and could be significantly more or less than the
Company’s current carried liability. For additional information on the Company’s GMWB liability, see Note 5 - Fair Value Measurements of Notes to
Consolidated Financial Statements.
99
