The Hartford 2014 Annual Report Download - page 110
Download and view the complete annual report
Please find page 110 of the 2014 The Hartford annual report below. You can navigate through the pages in the report by either clicking on the pages listed below, or by using the keyword search tool below to find specific information within the annual report.-
 1
1 -
2
-
3
-
4
-
5
-
6
-
7
-
8
-
9
-
10
-
11
-
12
-
13
-
14
-
15
-
16
-
17
-
18
-
19
-
20
-
21
-
22
-
23
-
24
-
25
-
26
-
27
-
28
-
29
-
30
-
31
-
32
-
33
-
34
-
35
-
36
-
37
-
38
-
39
-
40
-
41
-
42
-
43
-
44
-
45
-
46
-
47
-
48
-
49
-
50
-
51
-
52
-
53
-
54
-
55
-
56
-
57
-
58
-
59
-
60
-
61
-
62
-
63
-
64
-
65
-
66
-
67
-
68
-
69
-
70
-
71
-
72
-
73
-
74
-
75
-
76
-
77
-
78
-
79
-
80
-
81
-
82
-
83
-
84
-
85
-
86
-
87
-
88
-
89
-
90
-
91
-
92
-
93
-
94
-
95
-
96
-
97
-
98
-
99
-
 100
100 -
 101
101 -
 102
102 -
 103
103 -
 104
104 -
 105
105 -
 106
106 -
 107
107 -
 108
108 -
 109
109 -
 110
110 -
 111
111 -
 112
112 -
 113
113 -
 114
114 -
 115
115 -
 116
116 -
 117
117 -
 118
118 -
 119
119 -
 120
120 -
121
-
122
-
123
-
124
-
125
-
126
-
127
-
128
-
129
-
130
-
131
-
132
-
133
-
134
-
135
-
136
-
137
-
138
-
139
-
140
-
141
-
142
-
143
-
144
-
145
-
146
-
147
-
148
-
149
-
150
-
151
-
152
-
153
-
154
-
155
-
156
-
157
-
158
-
159
-
160
-
161
-
162
-
163
-
164
-
165
-
166
-
167
-
168
-
169
-
170
-
171
-
172
-
173
-
174
-
175
-
176
-
177
-
178
-
179
-
180
-
181
-
182
-
183
-
184
-
185
-
186
-
187
-
188
-
189
-
190
-
191
-
192
-
193
-
194
-
195
-
196
-
197
-
198
-
199
-
200
-
201
-
202
-
203
-
204
-
205
-
206
-
207
-
208
-
209
-
210
-
211
-
212
-
213
-
214
-
215
-
216
-
217
-
218
-
219
-
220
-
221
-
222
-
223
-
224
-
225
-
226
-
227
-
228
-
229
-
230
-
231
-
232
-
233
-
234
-
235
-
236
-
237
-
238
-
239
-
240
-
241
-
242
-
243
-
244
-
245
-
246
-
247
-
248
-
249
-
250
-
251
-
252
-
253
-
254
-
255
-
256
-
257
-
258
-
259
-
260
-
261
-
262
-
263
-
264
-
265
-
266
-
267
-
268
-
269
-
270
-
271
-
272
-
273
-
274
-
275
-
276
-
277
-
278
-
279
-
280
-
281
-
282
-
283
-
284
-
285
-
286
-
287
-
288
-
289
-
290
-
291
-
292
-
293
-
294
-
295
-
296
 |
 |

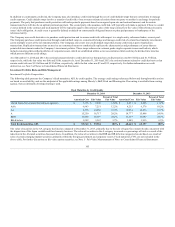
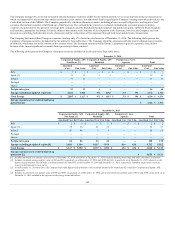
The Company’s European investment exposure largely relates to corporate entities which are domiciled in or generated a significant portion of its revenue
within the United Kingdom, Germany, the Netherlands and Switzerland. Entities domiciled in the United Kingdom comprise the Company's largest exposure;
as of December 31, 2014 and 2013, the exposure totals less than 3% of total invested assets. The majority of the European investments are U.S. dollar-
denominated, and those securities that are pound and euro-denominated are hedged to U.S. dollars or support foreign-denominated liabilities. For a
discussion of foreign currency risks, see the Foreign Currency Exchange Risk section of this MD&A. The Company does not hold any sovereign exposure to
the peripheral region and does not hold any exposure to issuers in Greece. As of December 31, 2014 and 2013, the Company’s unfunded commitments
associated with its investment portfolio was immaterial, and the weighted average credit quality of European investments was A- and A-, respectively.
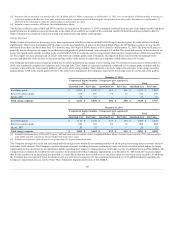
As of December 31, 2014 and 2013, the Company’s credit default swaps that provide credit protection on European issuers had a notional amount of $44 and
$190, respectively, and a fair value of $0 and $(1), respectively. As of December 31, 2014 and 2013 these credit default swaps that reference single name
corporate and financial European issuers, of which a notional value of $3 and $23, respectively, related to the peripheral region. The maturity dates of credit
defaults swaps are primarily consistent with the hedged bonds. For further information on the use of the Company’s credit derivatives and counterparty credit
quality, see Derivative Instruments within the Credit Risk section of this MD&A.
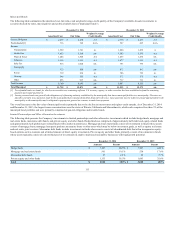
In addition to the credit risk associated with the investment portfolio, the Company has $231 of reinsurance recoverables due from legal entity counterparties
domiciled within Europe. For a more detail discussion of the Company's reinsurance arrangements, see Note 7 - Reinsurance of Notes to Consolidated
Financial Statements.
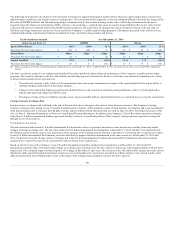
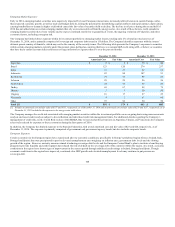
Financial Services
The Company’s exposure to the financial services sector is predominantly through investment grade banking and insurance institutions. The following table
presents the Company’s fixed maturity, AFS and equity, AFS securities in the financial services sector that are included in the Securities by Type table above.
AAA $ 31 $ 34 $ 3 $ 49 $ 52 $ 3
AA 401 436 35 468 493 25
A 2,610 2,804 194 2,518 2,616 98
BBB 1,681 1,734 53 1,978 1,952 (26)
BB & below 368 407 39 264 288 24
The Company's exposure to the financial services sector remained relatively consistent, as the impact of sales was largely offset by higher valuations due to a
decline in interest rates.
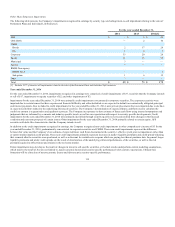
Commercial Real Estate
Commercial real estate market fundamentals, including property prices, financial conditions, transaction volume, and delinquencies, continue to improve. In
addition, the availability of credit has increased and there is now less concern about the ability of borrowers to refinance as loans come due.
110