The Hartford 2014 Annual Report Download - page 116
Download and view the complete annual report
Please find page 116 of the 2014 The Hartford annual report below. You can navigate through the pages in the report by either clicking on the pages listed below, or by using the keyword search tool below to find specific information within the annual report.-
 1
1 -
2
-
3
-
4
-
5
-
6
-
7
-
8
-
9
-
10
-
11
-
12
-
13
-
14
-
15
-
16
-
17
-
18
-
19
-
20
-
21
-
22
-
23
-
24
-
25
-
26
-
27
-
28
-
29
-
30
-
31
-
32
-
33
-
34
-
35
-
36
-
37
-
38
-
39
-
40
-
41
-
42
-
43
-
44
-
45
-
46
-
47
-
48
-
49
-
50
-
51
-
52
-
53
-
54
-
55
-
56
-
57
-
58
-
59
-
60
-
61
-
62
-
63
-
64
-
65
-
66
-
67
-
68
-
69
-
70
-
71
-
72
-
73
-
74
-
75
-
76
-
77
-
78
-
79
-
80
-
81
-
82
-
83
-
84
-
85
-
86
-
87
-
88
-
89
-
90
-
91
-
92
-
93
-
94
-
95
-
96
-
97
-
98
-
99
-
100
-
101
-
102
-
103
-
104
-
105
-
 106
106 -
 107
107 -
 108
108 -
 109
109 -
 110
110 -
 111
111 -
 112
112 -
 113
113 -
 114
114 -
 115
115 -
 116
116 -
 117
117 -
 118
118 -
 119
119 -
 120
120 -
 121
121 -
 122
122 -
 123
123 -
 124
124 -
 125
125 -
 126
126 -
127
-
128
-
129
-
130
-
131
-
132
-
133
-
134
-
135
-
136
-
137
-
138
-
139
-
140
-
141
-
142
-
143
-
144
-
145
-
146
-
147
-
148
-
149
-
150
-
151
-
152
-
153
-
154
-
155
-
156
-
157
-
158
-
159
-
160
-
161
-
162
-
163
-
164
-
165
-
166
-
167
-
168
-
169
-
170
-
171
-
172
-
173
-
174
-
175
-
176
-
177
-
178
-
179
-
180
-
181
-
182
-
183
-
184
-
185
-
186
-
187
-
188
-
189
-
190
-
191
-
192
-
193
-
194
-
195
-
196
-
197
-
198
-
199
-
200
-
201
-
202
-
203
-
204
-
205
-
206
-
207
-
208
-
209
-
210
-
211
-
212
-
213
-
214
-
215
-
216
-
217
-
218
-
219
-
220
-
221
-
222
-
223
-
224
-
225
-
226
-
227
-
228
-
229
-
230
-
231
-
232
-
233
-
234
-
235
-
236
-
237
-
238
-
239
-
240
-
241
-
242
-
243
-
244
-
245
-
246
-
247
-
248
-
249
-
250
-
251
-
252
-
253
-
254
-
255
-
256
-
257
-
258
-
259
-
260
-
261
-
262
-
263
-
264
-
265
-
266
-
267
-
268
-
269
-
270
-
271
-
272
-
273
-
274
-
275
-
276
-
277
-
278
-
279
-
280
-
281
-
282
-
283
-
284
-
285
-
286
-
287
-
288
-
289
-
290
-
291
-
292
-
293
-
294
-
295
-
296
 |
 |
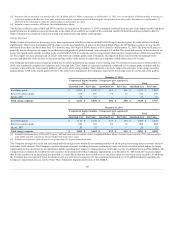
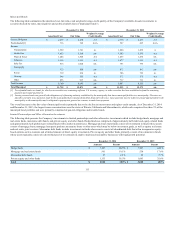
Year ended December 31, 2013
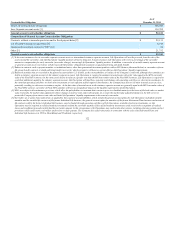
For the year ended December 31, 2013, impairments recognized in earnings were comprised of credit impairments of $32, primarily concentrated in corporate
and fixed rate CMBS bonds. Also, included were impairments on debt securities for which the Company had the intent-to-sell of $26, primarily related to
structured securities with exposure to commercial and residential real estate and corporate securities. In addition, impairments recognized in earnings
included impairments on equity securities of $15 that were in an unrealized loss position and the Company no longer believed the securities would recover
in the foreseeable future.
Year ended December 31, 2012
For the year ended December 31, 2012, impairments recognized in earnings were comprised of intent-to-sell impairments of $238, which included $177
related to the sale of the Retirement Plans and Individual Life businesses. Also included were impairments on equity securities of $63 largely comprised of
downgraded preferred equity securities of financial institutions. The Company's credit impairments totaled $48, primarily concentrated in structured
securities associated with residential and commercial real estate, as well as ABS small business.
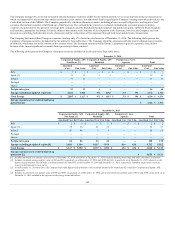
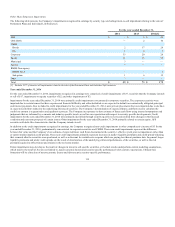
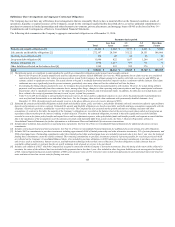
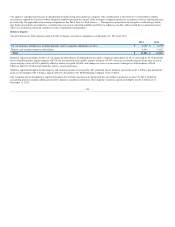
Valuation Allowances on Mortgage Loans
The following table presents (additions)/reversals to valuation allowances on mortgage loans.
Credit-related concerns $ (4) $ (2) $ 14
Year ended December 31, 2014
For the year ended December 31, 2014, the change in valuation allowances on mortgage loan additions of $4 was largely driven by individual property
performance. Continued improvement in commercial real estate property valuations will positively impact future loss development, with future impairments
driven by idiosyncratic loan-specific performance, as well as the necessity of risk reduction in the portfolio, rather than overall deteriorating market
fundamentals.
Year ended December 31, 2013
For the year ended December 31, 2013, the change in valuation allowances on mortgage loan additions of $2 was largely driven by individual property
performance.
Year ended December 31, 2012
For the year ended December 31, 2012, the change in valuation allowances on mortgage loan reversals of $14 was largely driven by recovery of the property
collateralizing a B-Note. The valuation allowance was reversed due to an increase in the valuation of the underlying collateral as a result of improved
occupancy rates and performance of the property.
116