The Hartford 2014 Annual Report Download - page 126
Download and view the complete annual report
Please find page 126 of the 2014 The Hartford annual report below. You can navigate through the pages in the report by either clicking on the pages listed below, or by using the keyword search tool below to find specific information within the annual report.-
 1
1 -
2
-
3
-
4
-
5
-
6
-
7
-
8
-
9
-
10
-
11
-
12
-
13
-
14
-
15
-
16
-
17
-
18
-
19
-
20
-
21
-
22
-
23
-
24
-
25
-
26
-
27
-
28
-
29
-
30
-
31
-
32
-
33
-
34
-
35
-
36
-
37
-
38
-
39
-
40
-
41
-
42
-
43
-
44
-
45
-
46
-
47
-
48
-
49
-
50
-
51
-
52
-
53
-
54
-
55
-
56
-
57
-
58
-
59
-
60
-
61
-
62
-
63
-
64
-
65
-
66
-
67
-
68
-
69
-
70
-
71
-
72
-
73
-
74
-
75
-
76
-
77
-
78
-
79
-
80
-
81
-
82
-
83
-
84
-
85
-
86
-
87
-
88
-
89
-
90
-
91
-
92
-
93
-
94
-
95
-
96
-
97
-
98
-
99
-
100
-
101
-
102
-
103
-
104
-
105
-
106
-
107
-
108
-
109
-
110
-
111
-
112
-
113
-
114
-
115
-
 116
116 -
 117
117 -
 118
118 -
 119
119 -
 120
120 -
 121
121 -
 122
122 -
 123
123 -
 124
124 -
 125
125 -
 126
126 -
 127
127 -
 128
128 -
 129
129 -
 130
130 -
 131
131 -
 132
132 -
 133
133 -
 134
134 -
 135
135 -
 136
136 -
137
-
138
-
139
-
140
-
141
-
142
-
143
-
144
-
145
-
146
-
147
-
148
-
149
-
150
-
151
-
152
-
153
-
154
-
155
-
156
-
157
-
158
-
159
-
160
-
161
-
162
-
163
-
164
-
165
-
166
-
167
-
168
-
169
-
170
-
171
-
172
-
173
-
174
-
175
-
176
-
177
-
178
-
179
-
180
-
181
-
182
-
183
-
184
-
185
-
186
-
187
-
188
-
189
-
190
-
191
-
192
-
193
-
194
-
195
-
196
-
197
-
198
-
199
-
200
-
201
-
202
-
203
-
204
-
205
-
206
-
207
-
208
-
209
-
210
-
211
-
212
-
213
-
214
-
215
-
216
-
217
-
218
-
219
-
220
-
221
-
222
-
223
-
224
-
225
-
226
-
227
-
228
-
229
-
230
-
231
-
232
-
233
-
234
-
235
-
236
-
237
-
238
-
239
-
240
-
241
-
242
-
243
-
244
-
245
-
246
-
247
-
248
-
249
-
250
-
251
-
252
-
253
-
254
-
255
-
256
-
257
-
258
-
259
-
260
-
261
-
262
-
263
-
264
-
265
-
266
-
267
-
268
-
269
-
270
-
271
-
272
-
273
-
274
-
275
-
276
-
277
-
278
-
279
-
280
-
281
-
282
-
283
-
284
-
285
-
286
-
287
-
288
-
289
-
290
-
291
-
292
-
293
-
294
-
295
-
296
 |
 |

The agencies consider many factors in determining the final rating of an insurance company. One consideration is the relative level of statutory surplus
necessary to support the business written. Statutory surplus represents the capital of the insurance company reported in accordance with accounting practices
prescribed by the applicable state insurance department. See Part I, Item 1A. Risk Factors — “Downgrades in our financial strength or credit ratings, which
may make our products less attractive, could increase our cost of capital and inhibit our ability to refinance our debt, which would have a material adverse
effect on our business, financial condition, results of operations and liquidity.”
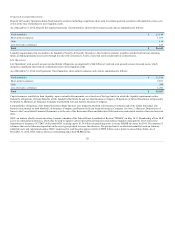
Statutory Surplus
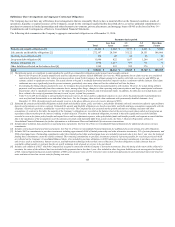
The table below sets forth statutory surplus for the Company’s insurance companies as of December 31, 2014 and 2013:
U.S. life insurance subsidiaries, includes domestic captive insurance subsidiaries in 2013 $ 7,157 $ 6,639
Property and casualty insurance subsidiaries 8,069 8,022
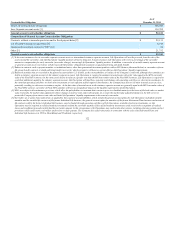
Statutory capital and surplus for the U.S. life insurance subsidiaries, including domestic captive insurance subsidiaries in 2013, increased by $518, primarily
due to variable annuity surplus impacts of $788, net income from non-variable annuity business of $187, increases in unrealized gains from other invested
assets carrying values of $138, partially offset by returns of capital of $500, and changes in reserves on account of change in valuation basis of $100.
Effective April 30, 2014 the last domestic captive ceased operations.
Statutory capital and surplus for the property and casualty insurance increased by $47, primarily due to statutory net income of $1.1 billion, and unrealized
gains on investments of $1.4 billion, largely offset by dividends to the HFSG Holding Company of $2.5 billion.
The Company also held regulatory capital and surplus for its former operations in Japan until the sale of those operations on June 30, 2014. Under the
accounting practices and procedures governed by Japanese regulatory authorities, the Company’s statutory capital and surplus was $1.2 billion as of
December 31, 2013.
126