The Hartford 2014 Annual Report Download - page 287
Download and view the complete annual report
Please find page 287 of the 2014 The Hartford annual report below. You can navigate through the pages in the report by either clicking on the pages listed below, or by using the keyword search tool below to find specific information within the annual report.-
 1
1 -
2
-
3
-
4
-
5
-
6
-
7
-
8
-
9
-
10
-
11
-
12
-
13
-
14
-
15
-
16
-
17
-
18
-
19
-
20
-
21
-
22
-
23
-
24
-
25
-
26
-
27
-
28
-
29
-
30
-
31
-
32
-
33
-
34
-
35
-
36
-
37
-
38
-
39
-
40
-
41
-
42
-
43
-
44
-
45
-
46
-
47
-
48
-
49
-
50
-
51
-
52
-
53
-
54
-
55
-
56
-
57
-
58
-
59
-
60
-
61
-
62
-
63
-
64
-
65
-
66
-
67
-
68
-
69
-
70
-
71
-
72
-
73
-
74
-
75
-
76
-
77
-
78
-
79
-
80
-
81
-
82
-
83
-
84
-
85
-
86
-
87
-
88
-
89
-
90
-
91
-
92
-
93
-
94
-
95
-
96
-
97
-
98
-
99
-
100
-
101
-
102
-
103
-
104
-
105
-
106
-
107
-
108
-
109
-
110
-
111
-
112
-
113
-
114
-
115
-
116
-
117
-
118
-
119
-
120
-
121
-
122
-
123
-
124
-
125
-
126
-
127
-
128
-
129
-
130
-
131
-
132
-
133
-
134
-
135
-
136
-
137
-
138
-
139
-
140
-
141
-
142
-
143
-
144
-
145
-
146
-
147
-
148
-
149
-
150
-
151
-
152
-
153
-
154
-
155
-
156
-
157
-
158
-
159
-
160
-
161
-
162
-
163
-
164
-
165
-
166
-
167
-
168
-
169
-
170
-
171
-
172
-
173
-
174
-
175
-
176
-
177
-
178
-
179
-
180
-
181
-
182
-
183
-
184
-
185
-
186
-
187
-
188
-
189
-
190
-
191
-
192
-
193
-
194
-
195
-
196
-
197
-
198
-
199
-
200
-
201
-
202
-
203
-
204
-
205
-
206
-
207
-
208
-
209
-
210
-
211
-
212
-
213
-
214
-
215
-
216
-
217
-
218
-
219
-
220
-
221
-
222
-
223
-
224
-
225
-
226
-
227
-
228
-
229
-
230
-
231
-
232
-
233
-
234
-
235
-
236
-
237
-
238
-
239
-
240
-
241
-
242
-
243
-
244
-
245
-
246
-
247
-
248
-
249
-
250
-
251
-
252
-
253
-
254
-
255
-
256
-
257
-
258
-
259
-
260
-
261
-
262
-
263
-
264
-
265
-
266
-
267
-
268
-
269
-
270
-
271
-
272
-
273
-
274
-
275
-
276
-
 277
277 -
 278
278 -
 279
279 -
 280
280 -
 281
281 -
 282
282 -
 283
283 -
 284
284 -
 285
285 -
 286
286 -
 287
287 -
 288
288 -
 289
289 -
 290
290 -
 291
291 -
 292
292 -
 293
293 -
 294
294 -
 295
295 -
 296
296
 |
 |

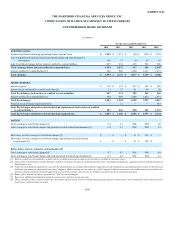
EXHIBIT 12.01
THE HARTFORD FINANCIAL SERVICES GROUP, INC.
COMPUTATION OF RATIOS OF EARNINGS TO FIXED CHARGES
AND PREFERRED SHARE DIVIDENDS
(In millions)
For the years ended December 31,
2014 2013 2012 2011 2010
EARNINGS (LOSS):
$ 1,699
Total earnings, before interest credited to contractholders 1,918 1,872 417 204 2,695
Total earnings $ 2,598 $ 2,732 $ 1,817 $ 1,639 $ 4,186
FIXED CHARGES:
Total fixed charges, before interest credited to contractholders 407 434 498 562 566
Total fixed charges 1,087 1,294 1,898 1,997 2,057
Total fixed charges and preferred stock dividend requirements, before interest credited
to contractholders 407 446 498 562 1,253
Total fixed charges and preferred stock dividend requirements $ 1,087 $ 1,306 $ 1,898 $ 1,997 $ 2,744
RATIOS:
[1] Interest credited to contractholders includes interest credited on general account assets and interest credited on consumer notes.
[2] Interest factor attributable to rental and others includes 1/3 of total rent expense as disclosed in the notes to the financial statements, capitalized interest and amortization of
debt issuance costs.
[3] Preferred stock dividend requirements represent the amount of pre-tax earnings that would be required to pay the dividends on outstanding preferred stock. Preferred stock
dividend requirements are determined using the Company's effective income tax rate unless use of the Company's effective income tax rate would result in pre-tax losses for
purposes of determining the dividend requirements, as in 2012 and 2011 when income tax benefits exceeded losses from continuing operations.
[4] Ratios of less than one-to-one are presented as “NM” or not meaningful.
[5] Represents additional earnings that would be necessary to result in a one-to-one ratio.
[6] These secondary ratios are disclosed for the convenience of fixed income investors and the rating agencies that serve them and are more comparable to the ratios disclosed
by all issuers of fixed income securities.