The Hartford 2014 Annual Report Download - page 107
Download and view the complete annual report
Please find page 107 of the 2014 The Hartford annual report below. You can navigate through the pages in the report by either clicking on the pages listed below, or by using the keyword search tool below to find specific information within the annual report.-
 1
1 -
2
-
3
-
4
-
5
-
6
-
7
-
8
-
9
-
10
-
11
-
12
-
13
-
14
-
15
-
16
-
17
-
18
-
19
-
20
-
21
-
22
-
23
-
24
-
25
-
26
-
27
-
28
-
29
-
30
-
31
-
32
-
33
-
34
-
35
-
36
-
37
-
38
-
39
-
40
-
41
-
42
-
43
-
44
-
45
-
46
-
47
-
48
-
49
-
50
-
51
-
52
-
53
-
54
-
55
-
56
-
57
-
58
-
59
-
60
-
61
-
62
-
63
-
64
-
65
-
66
-
67
-
68
-
69
-
70
-
71
-
72
-
73
-
74
-
75
-
76
-
77
-
78
-
79
-
80
-
81
-
82
-
83
-
84
-
85
-
86
-
87
-
88
-
89
-
90
-
91
-
92
-
93
-
94
-
95
-
96
-
 97
97 -
 98
98 -
 99
99 -
 100
100 -
 101
101 -
 102
102 -
 103
103 -
 104
104 -
 105
105 -
 106
106 -
 107
107 -
 108
108 -
 109
109 -
 110
110 -
 111
111 -
 112
112 -
 113
113 -
 114
114 -
 115
115 -
 116
116 -
 117
117 -
118
-
119
-
120
-
121
-
122
-
123
-
124
-
125
-
126
-
127
-
128
-
129
-
130
-
131
-
132
-
133
-
134
-
135
-
136
-
137
-
138
-
139
-
140
-
141
-
142
-
143
-
144
-
145
-
146
-
147
-
148
-
149
-
150
-
151
-
152
-
153
-
154
-
155
-
156
-
157
-
158
-
159
-
160
-
161
-
162
-
163
-
164
-
165
-
166
-
167
-
168
-
169
-
170
-
171
-
172
-
173
-
174
-
175
-
176
-
177
-
178
-
179
-
180
-
181
-
182
-
183
-
184
-
185
-
186
-
187
-
188
-
189
-
190
-
191
-
192
-
193
-
194
-
195
-
196
-
197
-
198
-
199
-
200
-
201
-
202
-
203
-
204
-
205
-
206
-
207
-
208
-
209
-
210
-
211
-
212
-
213
-
214
-
215
-
216
-
217
-
218
-
219
-
220
-
221
-
222
-
223
-
224
-
225
-
226
-
227
-
228
-
229
-
230
-
231
-
232
-
233
-
234
-
235
-
236
-
237
-
238
-
239
-
240
-
241
-
242
-
243
-
244
-
245
-
246
-
247
-
248
-
249
-
250
-
251
-
252
-
253
-
254
-
255
-
256
-
257
-
258
-
259
-
260
-
261
-
262
-
263
-
264
-
265
-
266
-
267
-
268
-
269
-
270
-
271
-
272
-
273
-
274
-
275
-
276
-
277
-
278
-
279
-
280
-
281
-
282
-
283
-
284
-
285
-
286
-
287
-
288
-
289
-
290
-
291
-
292
-
293
-
294
-
295
-
296
 |
 |
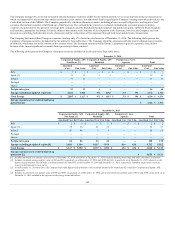
[3] Securities with an amortized cost and fair value of $1.0 billion and $1.1 billion, respectively, as of December 31, 2013, were reclassified in 2014 from utilities to energy as a
result of an update to the Barclays bond index which is the primary component used in determining the classification in the above table. The balances as of December 31,
2013 have been reclassified to reflect the categorization as of December 31, 2014.
[4] Included in equity securities, AFS on the Consolidated Balance Sheets.
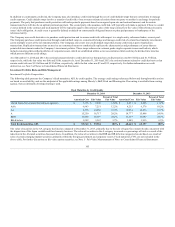
The decline in the fair value of AFS and FVO securities as compared to December 31, 2013 is primarily attributable to the sale of the Japan variable and fixed
annuity buisness. In addition assets declined due to the effect of net outflows as a result of the continued runoff of Talcott Resolution, partially offset by
higher valuations as a result of a decrease in long term interest rates and tighter credit spreads.
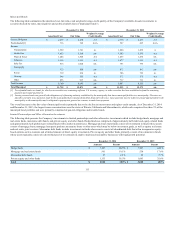
Energy Exposure
Market values of securities in the energy sector have experienced volatility in the second half of 2014 largely because prices for crude oil have declined
significantly. West Texas Intermediate (WTI) crude oil is the benchmark for oil prices in the United States. Prices for WTI futures contracts for one month
forward delivery have declined more than 51% from the June 2014 high of $108 a barrel, to $53 a barrel as of December 31, 2014. The drop in oil prices is
primarily due to an increase in supply, lower than expected growth in global demand, and a stronger U.S. dollar. The speed and severity of the decline in oil
prices has caused credit spreads to widen in the second half of 2014 for corporate and sovereign issuers that generate a large portion of their revenues from
oil. The impact was more pronounced on issuers with below investment grade credit. Ultimately, the impact on these issuers will be determined by the
severity and duration of the decline in oil prices and the ability of the issuers to adjust their cost structure or find other sources of revenue.
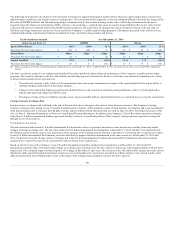
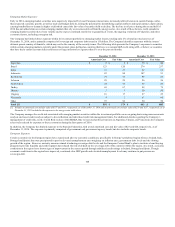
The Company has limited direct exposure within its investment portfolio to the energy sector, totaling only 5% of total invested assets as of December 31,
2014, and is primarily comprised of corporate and sovereign debt. The Company's exposure is primarily comprised of investment grade securities and the
exposure is diversified by issuer and in different sub sectors of the energy market. The Company selectively reduced its exposure to the energy sector by
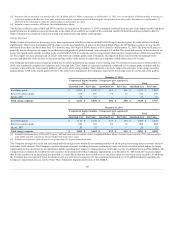
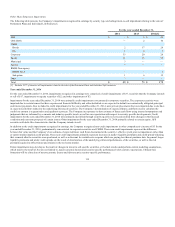
approximately $300 in the fourth quarter of 2014. The table below summarizes the Company's exposure to the energy sector by sector and credit quality.
Investment grade $ 2,923 $ 3,162 $ 268 $ 266 $ 3,191 $ 3,428
Below investment grade 288 266 36 32 324 298
Equity, AFS 23 21 — — 23 21
Investment grade $ 3,114 $ 3,338 $ 355 $ 340 $ 3,469 $ 3,678
Below investment grade 320 324 84 78 404 402
Equity, AFS 20 22 — — 20 22
[1] Included in fixed maturities, AFS and FVO, equity, AFS and short-term investments on the Consolidated Balance Sheets. Excludes equity securities, FVO with cost and fair
value of $45 and $45, respectively, that are hedged with total return swaps.
[2] Includes sovereigns for which oil exports are greater than 4% of gross domestic product.
The Company manages the credit risk associated with the energy sector within the investment portfolio on an on-going basis using macroeconomic analysis
and issuer credit analysis. The Company considers alternate scenarios including oil prices remaining at low levels for an extended period and/or declining
significantly below current levels. For additional details regarding the Company’s management of credit risks, see the Credit Risk Section of this MD&A. The
Company has evaluated all available-for-sale securities for potential other-than-temporary impairments as of December 31, 2014 and 2013 and concluded
that for the securities in an unrealized loss position, it is more likely than not that we will recover our entire amortized cost basis in the securities. In addition,
the Company does not currently have the intent-to-sell, nor will we be required to sell, the securities discussed above. For additional details regarding the
Company’s impairment process, see the Other-Than-Temporary Impairments Section of this MD&A.
107