The Hartford 2014 Annual Report Download - page 169
Download and view the complete annual report
Please find page 169 of the 2014 The Hartford annual report below. You can navigate through the pages in the report by either clicking on the pages listed below, or by using the keyword search tool below to find specific information within the annual report.-
 1
1 -
2
-
3
-
4
-
5
-
6
-
7
-
8
-
9
-
10
-
11
-
12
-
13
-
14
-
15
-
16
-
17
-
18
-
19
-
20
-
21
-
22
-
23
-
24
-
25
-
26
-
27
-
28
-
29
-
30
-
31
-
32
-
33
-
34
-
35
-
36
-
37
-
38
-
39
-
40
-
41
-
42
-
43
-
44
-
45
-
46
-
47
-
48
-
49
-
50
-
51
-
52
-
53
-
54
-
55
-
56
-
57
-
58
-
59
-
60
-
61
-
62
-
63
-
64
-
65
-
66
-
67
-
68
-
69
-
70
-
71
-
72
-
73
-
74
-
75
-
76
-
77
-
78
-
79
-
80
-
81
-
82
-
83
-
84
-
85
-
86
-
87
-
88
-
89
-
90
-
91
-
92
-
93
-
94
-
95
-
96
-
97
-
98
-
99
-
100
-
101
-
102
-
103
-
104
-
105
-
106
-
107
-
108
-
109
-
110
-
111
-
112
-
113
-
114
-
115
-
116
-
117
-
118
-
119
-
120
-
121
-
122
-
123
-
124
-
125
-
126
-
127
-
128
-
129
-
130
-
131
-
132
-
133
-
134
-
135
-
136
-
137
-
138
-
139
-
140
-
141
-
142
-
143
-
144
-
145
-
146
-
147
-
148
-
149
-
150
-
151
-
152
-
153
-
154
-
155
-
156
-
157
-
158
-
 159
159 -
 160
160 -
 161
161 -
 162
162 -
 163
163 -
 164
164 -
 165
165 -
 166
166 -
 167
167 -
 168
168 -
 169
169 -
 170
170 -
 171
171 -
 172
172 -
 173
173 -
 174
174 -
 175
175 -
 176
176 -
 177
177 -
 178
178 -
 179
179 -
180
-
181
-
182
-
183
-
184
-
185
-
186
-
187
-
188
-
189
-
190
-
191
-
192
-
193
-
194
-
195
-
196
-
197
-
198
-
199
-
200
-
201
-
202
-
203
-
204
-
205
-
206
-
207
-
208
-
209
-
210
-
211
-
212
-
213
-
214
-
215
-
216
-
217
-
218
-
219
-
220
-
221
-
222
-
223
-
224
-
225
-
226
-
227
-
228
-
229
-
230
-
231
-
232
-
233
-
234
-
235
-
236
-
237
-
238
-
239
-
240
-
241
-
242
-
243
-
244
-
245
-
246
-
247
-
248
-
249
-
250
-
251
-
252
-
253
-
254
-
255
-
256
-
257
-
258
-
259
-
260
-
261
-
262
-
263
-
264
-
265
-
266
-
267
-
268
-
269
-
270
-
271
-
272
-
273
-
274
-
275
-
276
-
277
-
278
-
279
-
280
-
281
-
282
-
283
-
284
-
285
-
286
-
287
-
288
-
289
-
290
-
291
-
292
-
293
-
294
-
295
-
296
 |
 |

Table of Contents
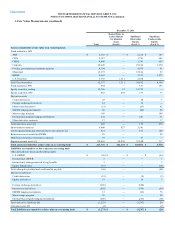
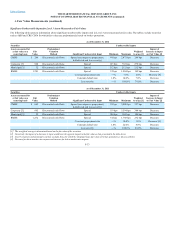
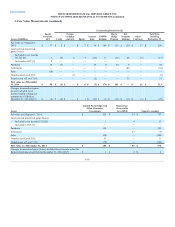
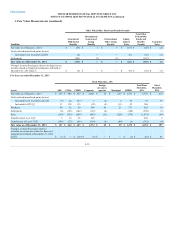
Significant Unobservable Inputs for Level 3 Assets Measured at Fair Values
The following tables present information about significant unobservable inputs used in Level 3 assets measured at fair value. The tables exclude securities
such as ABS and CRE CDOs for which fair values are predominately based on broker quotations.
CMBS $ 284 Discounted cash flows Spread (encompasses prepayment,
default risk and loss severity)
46 bps 2,475 bps 284 bps Decrease
Corporate [3] 568 Discounted cash flows Spread 123 bps 765 bps 279 bps Decrease
Municipal [3] 32 Discounted cash flows Spread 212 bps 212 bps 212 bps Decrease
RMBS 1,281 Discounted cash flows Spread 23 bps 1,904 bps 142 bps Decrease
Constant prepayment rate —% 7.0% 2.0% Decrease [4]
Constant default rate 1.0% 14.0% 7.0% Decrease
Loss severity —% 100.0% 78.0% Decrease
CMBS $ 663 Discounted cash flows Spread (encompasses prepayment,
default risk and loss severity)
99 bps 3,000 bps 527 bps Decrease
Corporate [3] 665 Discounted cash flows Spread 119 bps 5,594 bps 344 bps Decrease
Municipal [3] 29 Discounted cash flows Spread 184 bps 184 bps 184 bps Decrease
RMBS 1,272 Discounted cash flows Spread 62 bps 1,748 bps 232 bps Decrease
Constant prepayment rate —% 10.0% 3.0% Decrease [4]
Constant default rate 1.0% 22.0% 8.0% Decrease
Loss severity —% 100.0% 80.0% Decrease
[1] The weighted average is determined based on the fair value of the securities.
[2] Conversely, the impact of a decrease in input would have the opposite impact to the fair value as that presented in the table above.
[3] Level 3 corporate and municipal securities excludes those for which the Company bases fair value on broker quotations as discussed below.
[4] Decrease for above market rate coupons and increase for below market rate coupons.
F-33