The Hartford 2014 Annual Report Download - page 193
Download and view the complete annual report
Please find page 193 of the 2014 The Hartford annual report below. You can navigate through the pages in the report by either clicking on the pages listed below, or by using the keyword search tool below to find specific information within the annual report.-
 1
1 -
2
-
3
-
4
-
5
-
6
-
7
-
8
-
9
-
10
-
11
-
12
-
13
-
14
-
15
-
16
-
17
-
18
-
19
-
20
-
21
-
22
-
23
-
24
-
25
-
26
-
27
-
28
-
29
-
30
-
31
-
32
-
33
-
34
-
35
-
36
-
37
-
38
-
39
-
40
-
41
-
42
-
43
-
44
-
45
-
46
-
47
-
48
-
49
-
50
-
51
-
52
-
53
-
54
-
55
-
56
-
57
-
58
-
59
-
60
-
61
-
62
-
63
-
64
-
65
-
66
-
67
-
68
-
69
-
70
-
71
-
72
-
73
-
74
-
75
-
76
-
77
-
78
-
79
-
80
-
81
-
82
-
83
-
84
-
85
-
86
-
87
-
88
-
89
-
90
-
91
-
92
-
93
-
94
-
95
-
96
-
97
-
98
-
99
-
100
-
101
-
102
-
103
-
104
-
105
-
106
-
107
-
108
-
109
-
110
-
111
-
112
-
113
-
114
-
115
-
116
-
117
-
118
-
119
-
120
-
121
-
122
-
123
-
124
-
125
-
126
-
127
-
128
-
129
-
130
-
131
-
132
-
133
-
134
-
135
-
136
-
137
-
138
-
139
-
140
-
141
-
142
-
143
-
144
-
145
-
146
-
147
-
148
-
149
-
150
-
151
-
152
-
153
-
154
-
155
-
156
-
157
-
158
-
159
-
160
-
161
-
162
-
163
-
164
-
165
-
166
-
167
-
168
-
169
-
170
-
171
-
172
-
173
-
174
-
175
-
176
-
177
-
178
-
179
-
180
-
181
-
182
-
 183
183 -
 184
184 -
 185
185 -
 186
186 -
 187
187 -
 188
188 -
 189
189 -
 190
190 -
 191
191 -
 192
192 -
 193
193 -
 194
194 -
 195
195 -
 196
196 -
 197
197 -
 198
198 -
 199
199 -
 200
200 -
 201
201 -
 202
202 -
 203
203 -
204
-
205
-
206
-
207
-
208
-
209
-
210
-
211
-
212
-
213
-
214
-
215
-
216
-
217
-
218
-
219
-
220
-
221
-
222
-
223
-
224
-
225
-
226
-
227
-
228
-
229
-
230
-
231
-
232
-
233
-
234
-
235
-
236
-
237
-
238
-
239
-
240
-
241
-
242
-
243
-
244
-
245
-
246
-
247
-
248
-
249
-
250
-
251
-
252
-
253
-
254
-
255
-
256
-
257
-
258
-
259
-
260
-
261
-
262
-
263
-
264
-
265
-
266
-
267
-
268
-
269
-
270
-
271
-
272
-
273
-
274
-
275
-
276
-
277
-
278
-
279
-
280
-
281
-
282
-
283
-
284
-
285
-
286
-
287
-
288
-
289
-
290
-
291
-
292
-
293
-
294
-
295
-
296
 |
 |
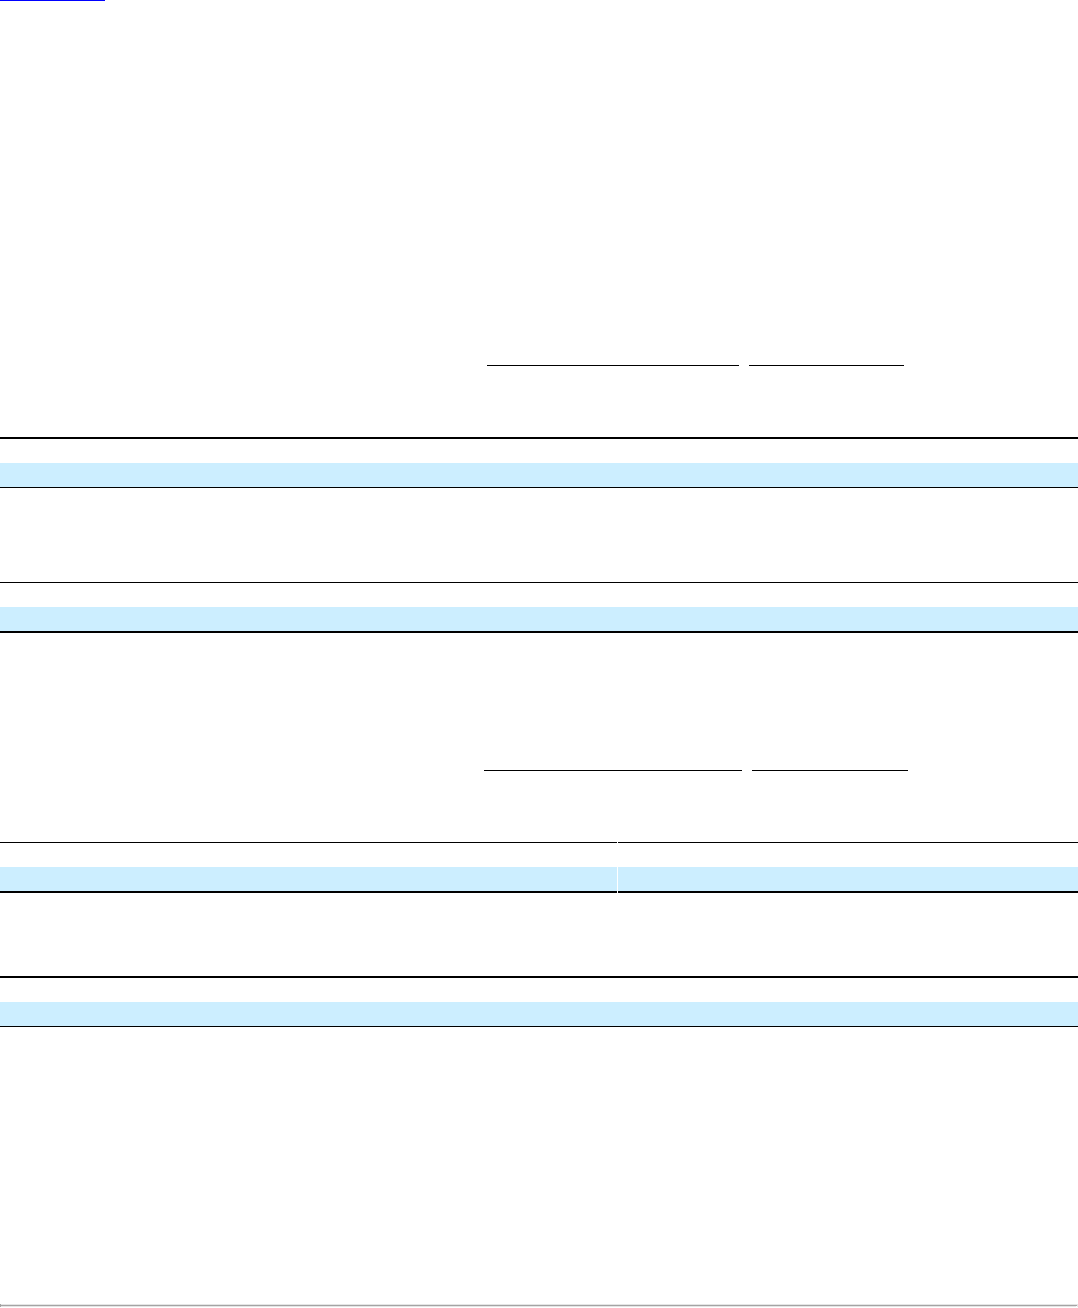
Table of Contents
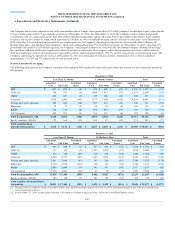
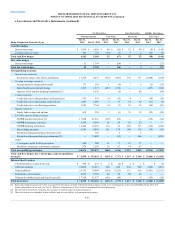
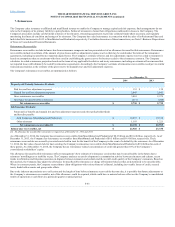
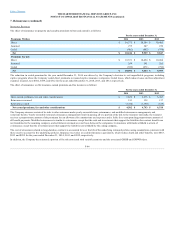
Offsetting of Derivative Assets/Liabilities
The following tables present the gross fair value amounts, the amounts offset, and net position of derivative instruments eligible for offset in the Company's
Consolidated Balance Sheets. Amounts offset include fair value amounts, income accruals and related cash collateral receivables and payables associated
with derivative instruments that are traded under a common master netting agreement, as described above. Also included in the tables are financial collateral
receivables and payables, which is contractually permitted to be offset upon an event of default, although is disallowed for offsetting under U.S. GAAP.
Other investments $ 1,175
$ 969
$ 364
$ (158)
$ 109
$ 97
Other liabilities $ (1,741)
$ (799)
$ (927)
$ (15)
$ (1,079)
$ 137
Other investments $ 1,845
$ 1,463
$ 442
$ (60)
$ 242
$ 140
Other liabilities $ (2,626)
$ (1,496)
$ (1,223)
$ 93
$ (1,204)
$ 74
[1] Included in other investments in the Company's Consolidated Balance Sheets.
[2] Included in other assets in the Company's Consolidated Balance Sheets and is limited to the net derivative receivable associated with each counterparty.
[3] Included in other liabilities in the Company's Consolidated Balance Sheets and is limited to the net derivative payable associated with each counterparty. Not included in this
amount are embedded derivatives associated with consumer notes of $(3) and $(2) as of December 31, 2014 and December 31, 2013, respectively, which were not eligible
for offset in the Company's Consolidated Balance Sheets.
[4] Excludes collateral associated with exchange-traded derivatives instruments.
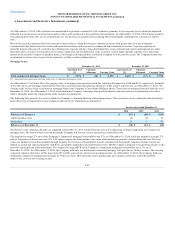
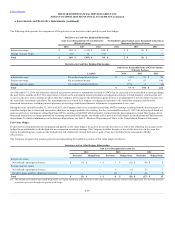
For derivative instruments that are designated and qualify as cash flow hedges, the effective portion of the gain or loss on the derivative is reported as a
component of OCI and reclassified into earnings in the same period or periods during which the hedged transaction affects earnings. Gains and losses on the
derivative representing hedge ineffectiveness are recognized in current period earnings. All components of each derivative’s gain or loss were included in the
assessment of hedge effectiveness.
F-57