The Hartford 2014 Annual Report Download - page 76
Download and view the complete annual report
Please find page 76 of the 2014 The Hartford annual report below. You can navigate through the pages in the report by either clicking on the pages listed below, or by using the keyword search tool below to find specific information within the annual report.-
 1
1 -
 2
2 -
 3
3 -
 4
4 -
 5
5 -
 6
6 -
 7
7 -
 8
8 -
 9
9 -
 10
10 -
 11
11 -
 12
12 -
 13
13 -
 14
14 -
 15
15 -
 16
16 -
 17
17 -
 18
18 -
 19
19 -
 20
20 -
 21
21 -
 22
22 -
 23
23 -
 24
24 -
 25
25 -
 26
26 -
 27
27 -
 28
28 -
 29
29 -
 30
30 -
 31
31 -
 32
32 -
 33
33 -
 34
34 -
 35
35 -
 36
36 -
 37
37 -
 38
38 -
 39
39 -
 40
40 -
 41
41 -
 42
42 -
 43
43 -
 44
44 -
 45
45 -
 46
46 -
 47
47 -
 48
48 -
 49
49 -
 50
50 -
 51
51 -
 52
52 -
 53
53 -
 54
54 -
 55
55 -
 56
56 -
 57
57 -
 58
58 -
 59
59 -
 60
60 -
 61
61 -
 62
62 -
 63
63 -
 64
64 -
 65
65 -
 66
66 -
 67
67 -
 68
68 -
 69
69 -
 70
70 -
 71
71 -
 72
72 -
 73
73 -
 74
74 -
 75
75 -
 76
76 -
 77
77 -
 78
78 -
 79
79 -
 80
80 -
 81
81 -
 82
82 -
 83
83 -
 84
84 -
 85
85 -
 86
86 -
 87
87 -
 88
88 -
 89
89 -
 90
90 -
 91
91 -
 92
92 -
 93
93 -
 94
94 -
 95
95 -
 96
96 -
 97
97 -
 98
98 -
 99
99 -
 100
100 -
 101
101 -
 102
102 -
 103
103 -
 104
104 -
 105
105 -
 106
106 -
 107
107 -
 108
108 -
 109
109 -
 110
110 -
 111
111 -
 112
112 -
 113
113 -
 114
114 -
 115
115 -
 116
116 -
 117
117 -
 118
118 -
 119
119 -
 120
120 -
 121
121 -
 122
122 -
 123
123 -
 124
124 -
 125
125 -
 126
126 -
 127
127 -
 128
128 -
 129
129 -
 130
130 -
 131
131 -
 132
132 -
 133
133 -
 134
134 -
 135
135 -
 136
136 -
 137
137 -
 138
138 -
 139
139 -
 140
140 -
 141
141 -
 142
142 -
 143
143 -
 144
144 -
 145
145 -
 146
146 -
 147
147 -
 148
148 -
 149
149 -
 150
150 -
 151
151 -
 152
152 -
 153
153 -
 154
154 -
 155
155 -
 156
156 -
 157
157 -
 158
158 -
 159
159 -
 160
160 -
 161
161 -
 162
162 -
 163
163 -
 164
164 -
 165
165 -
 166
166 -
 167
167 -
 168
168 -
 169
169 -
 170
170 -
 171
171 -
 172
172 -
 173
173 -
 174
174 -
 175
175 -
 176
176 -
 177
177 -
 178
178 -
 179
179 -
 180
180 -
 181
181 -
 182
182 -
 183
183 -
 184
184 -
 185
185 -
 186
186 -
 187
187 -
 188
188 -
 189
189 -
 190
190 -
 191
191 -
 192
192 -
 193
193 -
 194
194 -
 195
195 -
 196
196 -
 197
197 -
 198
198 -
 199
199 -
 200
200 -
 201
201 -
 202
202 -
 203
203 -
 204
204 -
 205
205 -
 206
206 -
 207
207 -
 208
208 -
 209
209 -
 210
210 -
 211
211 -
 212
212 -
 213
213 -
 214
214 -
 215
215 -
 216
216 -
 217
217 -
 218
218 -
 219
219 -
 220
220 -
 221
221 -
 222
222 -
 223
223 -
 224
224 -
 225
225 -
 226
226 -
 227
227 -
 228
228 -
 229
229 -
 230
230 -
 231
231 -
 232
232 -
 233
233 -
 234
234 -
 235
235 -
 236
236 -
 237
237 -
 238
238 -
 239
239 -
 240
240 -
 241
241 -
 242
242 -
 243
243 -
 244
244 -
 245
245 -
 246
246 -
 247
247 -
 248
248 -
 249
249 -
 250
250 -
 251
251 -
 252
252 -
 253
253 -
 254
254 -
 255
255 -
 256
256 -
 257
257 -
 258
258 -
 259
259 -
 260
260 -
 261
261 -
 262
262 -
 263
263 -
 264
264 -
 265
265 -
 266
266 -
 267
267 -
 268
268 -
 269
269 -
 270
270 -
 271
271 -
 272
272 -
 273
273 -
 274
274 -
 275
275 -
 276
276 -
 277
277 -
 278
278 -
 279
279 -
 280
280 -
 281
281 -
 282
282 -
 283
283 -
 284
284 -
 285
285 -
 286
286 -
 287
287 -
 288
288 -
 289
289 -
 290
290 -
 291
291 -
 292
292 -
 293
293 -
 294
294 -
 295
295 -
 296
296
 |
 |

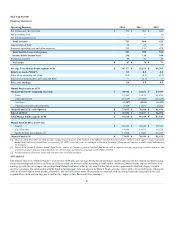
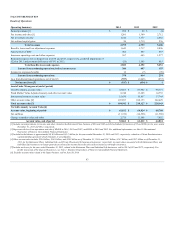
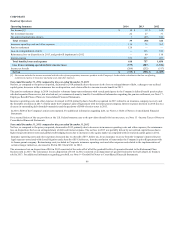
Year ended December 31, 2014 compared to the year ended December 31, 2013
Overview
Net income, as compared to the prior year period, decreased in 2014 primarily due to a change to net realized capital losses and a decrease in net servicing
income, partially offset by improvements in underwriting results, driven by higher earned premiums and lower underwriting expenses.
Revenues - Earned and Written Premiums
Earned and written premiums increased in 2014 reflecting new business written premium growth in auto, primarily from AARP Direct and AARP Agency,
improved earned pricing increases in both auto and homeowners, and continued high levels of premium retention.
Losses and Loss Adjustment Expenses
Losses and loss adjustment expenses reflect an increase in current accident year loss and loss adjustment expenses before catastrophes and higher current
accident year catastrophes, partially offset by higher favorable prior accident years development.
• Current accident year losses and loss adjustment expenses before catastrophes increased in 2014 compared to 2013 driven by growth in earned
premium, partially offset by a decline in the current accident year loss and loss adjustment expense ratio before catastrophes to 65.6 in 2014 from
65.9 in 2013.
• Current accident year catastrophe losses of $232, before tax, in 2014 compared to $207, before tax, in 2013. Losses in 2014 were primarily due to
multiple thunderstorm and winter storm events across various U.S. geographic regions. Losses in 2013 were primarily due to multiple thunderstorm,
hail and tornado events across various U.S. geographic regions. For additional information, see MD&A - Critical Accounting Estimates, Property and
Casualty Insurance Product Reserves, Net of Reinsurance.
• Prior accident years reserve releases of $46, before tax, in 2014 compared to $39, before tax, in 2013. Reserve releases in 2014 were primarily related
to prior accident year catastrophes, as well as prior accident year homeowners and extra contractual liability reserves. Reserve releases in 2013 were
primarily related to Storm Sandy. For additional information, see MD&A - Critical Accounting Estimates, Property and Casualty Insurance Product
Reserves, Net of Reinsurance.
Underwriting Ratios
The combined ratio, before current accident year catastrophes and prior year development, improved to 90.6 in 2014 from 92.3 in 2013.
Investment Results
Investment income decreased in 2014, as compared to the prior year period. For discussion of consolidated investment results, see MD&A - Investment
Results, Net Investment Income (Loss) and Net Realized Capital Gains (Losses).
Income Taxes
The effective tax rates in 2014 and 2013 differ from the U.S. Federal statutory rate of 35% primarily due to permanent differences related to investments in tax
exempt securities. For further discussion of income taxes, see Note 13 - Income Taxes of Notes to Consolidated Financial Statements.
Year ended December 31, 2013 compared to the year ended December 31, 2012
Overview
Net income, as compared to the prior year period, increased in 2013 primarily due to improvements in underwriting results, driven by lower current year
catastrophes partially offset by lower favorable prior year development.
Revenues - Earned and Written Premiums
Earned and written premiums increased in 2013, reflecting new business written premium growth in auto and home, primarily from the AARP Direct and
AARP through agents distribution channels and improved policy count retention in auto and home due to initiatives implemented over the last two years.
76
