The Hartford 2014 Annual Report Download - page 34
Download and view the complete annual report
Please find page 34 of the 2014 The Hartford annual report below. You can navigate through the pages in the report by either clicking on the pages listed below, or by using the keyword search tool below to find specific information within the annual report.-
 1
1 -
2
-
3
-
4
-
5
-
6
-
7
-
8
-
9
-
10
-
11
-
12
-
13
-
14
-
15
-
16
-
17
-
18
-
19
-
20
-
21
-
22
-
23
-
 24
24 -
 25
25 -
 26
26 -
 27
27 -
 28
28 -
 29
29 -
 30
30 -
 31
31 -
 32
32 -
 33
33 -
 34
34 -
 35
35 -
 36
36 -
 37
37 -
 38
38 -
 39
39 -
 40
40 -
 41
41 -
 42
42 -
 43
43 -
 44
44 -
45
-
46
-
47
-
48
-
49
-
50
-
51
-
52
-
53
-
54
-
55
-
56
-
57
-
58
-
59
-
60
-
61
-
62
-
63
-
64
-
65
-
66
-
67
-
68
-
69
-
70
-
71
-
72
-
73
-
74
-
75
-
76
-
77
-
78
-
79
-
80
-
81
-
82
-
83
-
84
-
85
-
86
-
87
-
88
-
89
-
90
-
91
-
92
-
93
-
94
-
95
-
96
-
97
-
98
-
99
-
100
-
101
-
102
-
103
-
104
-
105
-
106
-
107
-
108
-
109
-
110
-
111
-
112
-
113
-
114
-
115
-
116
-
117
-
118
-
119
-
120
-
121
-
122
-
123
-
124
-
125
-
126
-
127
-
128
-
129
-
130
-
131
-
132
-
133
-
134
-
135
-
136
-
137
-
138
-
139
-
140
-
141
-
142
-
143
-
144
-
145
-
146
-
147
-
148
-
149
-
150
-
151
-
152
-
153
-
154
-
155
-
156
-
157
-
158
-
159
-
160
-
161
-
162
-
163
-
164
-
165
-
166
-
167
-
168
-
169
-
170
-
171
-
172
-
173
-
174
-
175
-
176
-
177
-
178
-
179
-
180
-
181
-
182
-
183
-
184
-
185
-
186
-
187
-
188
-
189
-
190
-
191
-
192
-
193
-
194
-
195
-
196
-
197
-
198
-
199
-
200
-
201
-
202
-
203
-
204
-
205
-
206
-
207
-
208
-
209
-
210
-
211
-
212
-
213
-
214
-
215
-
216
-
217
-
218
-
219
-
220
-
221
-
222
-
223
-
224
-
225
-
226
-
227
-
228
-
229
-
230
-
231
-
232
-
233
-
234
-
235
-
236
-
237
-
238
-
239
-
240
-
241
-
242
-
243
-
244
-
245
-
246
-
247
-
248
-
249
-
250
-
251
-
252
-
253
-
254
-
255
-
256
-
257
-
258
-
259
-
260
-
261
-
262
-
263
-
264
-
265
-
266
-
267
-
268
-
269
-
270
-
271
-
272
-
273
-
274
-
275
-
276
-
277
-
278
-
279
-
280
-
281
-
282
-
283
-
284
-
285
-
286
-
287
-
288
-
289
-
290
-
291
-
292
-
293
-
294
-
295
-
296
 |
 |

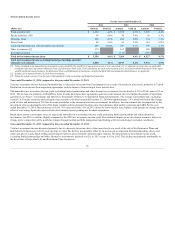
The investment return, or yield, on invested assets is an important element of the Company’s earnings since insurance products are priced with the
assumption that premiums received can be invested for a period of time before benefits, loss and loss adjustment expenses are paid. Due to the need to
maintain sufficient liquidity to satisfy claim obligations, the majority of the Company’s invested assets have been held in available-for-sale securities,
including, among other asset classes, corporate bonds, municipal bonds, government debt, short-term debt, mortgage-backed securities and asset-backed
securities.
The primary investment objective for the Company is to maximize economic value, consistent with acceptable risk parameters, including the management of
credit risk and interest rate sensitivity of invested assets, while generating sufficient after-tax income to meet policyholder and corporate obligations.
Investment strategies are developed based on a variety of factors including business needs, regulatory requirements and tax considerations.
For more information on the Company's reporting segments, refer to Part I, Item 1, Business — Reporting Segments.
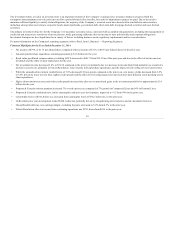
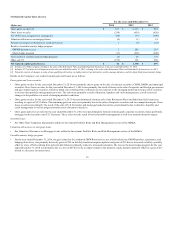
Financial Highlights for the Year Ended December 31, 2014
• Net income of $798, or $1.73 per diluted share, compared with net income of $176, or $0.36 per diluted share, for the prior year.
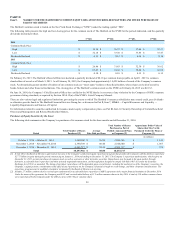
• Amounts paid for share repurchases totaled approximately $1.8 billion for the year.
• Book value per diluted common share (excluding AOCI) increased to $40.71 from $39.30 as of the prior year end due to the effect of net income less
dividends and the effect of share repurchases for the year.
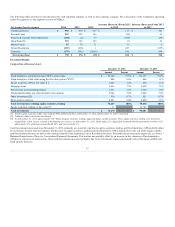
• Net investment income decreased 3.4% to $3,154 compared to the prior year primarily due to a decrease in income from fixed maturities as a result of a
decline in asset levels, primarily in Talcott Resolution, lower income from repurchase agreements, and the impact of reinvesting at lower interest rates.
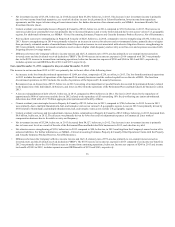
• While the annualized investment yield after-tax of 3.0% decreased 10 basis points compared to the prior year, new money yields decreased from 3.8%
to 3.6% driven by lower interest rates, tighter credit spreads and the effect of reinvesting Japan sales proceeds into short-duration assets pending use for
share repurchases.
• Higher short term interest rates and wider credit spreads increased the after-tax net unrealized gains in the investment portfolio by approximately $1.4
billion for the year.
• Property & Casualty written premium increased 3% over the prior year, comprised of 3% growth in Commercial Lines and 4% in Personal Lines.
• Property & Casualty combined ratio, before catastrophes and prior year development, improved to 91.5 from 94.4 in the prior year.
• Catastrophe losses of $341, before tax, increased from catastrophe losses of $312, before tax, in the prior year.
• Unfavorable prior year development totaled $228, before tax, primarily driven by strengthening of net asbestos and environmental reserves.
• Group Benefits after-tax core earnings margin, excluding buyouts, increased to 5.2% from 4.3% in the prior year.
• Talcott Resolution after-tax income from continuing operations was $370, down from $414 in the prior year.
34