The Hartford 2014 Annual Report Download - page 124
Download and view the complete annual report
Please find page 124 of the 2014 The Hartford annual report below. You can navigate through the pages in the report by either clicking on the pages listed below, or by using the keyword search tool below to find specific information within the annual report.-
 1
1 -
2
-
3
-
4
-
5
-
6
-
7
-
8
-
9
-
10
-
11
-
12
-
13
-
14
-
15
-
16
-
17
-
18
-
19
-
20
-
21
-
22
-
23
-
24
-
25
-
26
-
27
-
28
-
29
-
30
-
31
-
32
-
33
-
34
-
35
-
36
-
37
-
38
-
39
-
40
-
41
-
42
-
43
-
44
-
45
-
46
-
47
-
48
-
49
-
50
-
51
-
52
-
53
-
54
-
55
-
56
-
57
-
58
-
59
-
60
-
61
-
62
-
63
-
64
-
65
-
66
-
67
-
68
-
69
-
70
-
71
-
72
-
73
-
74
-
75
-
76
-
77
-
78
-
79
-
80
-
81
-
82
-
83
-
84
-
85
-
86
-
87
-
88
-
89
-
90
-
91
-
92
-
93
-
94
-
95
-
96
-
97
-
98
-
99
-
100
-
101
-
102
-
103
-
104
-
105
-
106
-
107
-
108
-
109
-
110
-
111
-
112
-
113
-
 114
114 -
 115
115 -
 116
116 -
 117
117 -
 118
118 -
 119
119 -
 120
120 -
 121
121 -
 122
122 -
 123
123 -
 124
124 -
 125
125 -
 126
126 -
 127
127 -
 128
128 -
 129
129 -
 130
130 -
 131
131 -
 132
132 -
 133
133 -
 134
134 -
135
-
136
-
137
-
138
-
139
-
140
-
141
-
142
-
143
-
144
-
145
-
146
-
147
-
148
-
149
-
150
-
151
-
152
-
153
-
154
-
155
-
156
-
157
-
158
-
159
-
160
-
161
-
162
-
163
-
164
-
165
-
166
-
167
-
168
-
169
-
170
-
171
-
172
-
173
-
174
-
175
-
176
-
177
-
178
-
179
-
180
-
181
-
182
-
183
-
184
-
185
-
186
-
187
-
188
-
189
-
190
-
191
-
192
-
193
-
194
-
195
-
196
-
197
-
198
-
199
-
200
-
201
-
202
-
203
-
204
-
205
-
206
-
207
-
208
-
209
-
210
-
211
-
212
-
213
-
214
-
215
-
216
-
217
-
218
-
219
-
220
-
221
-
222
-
223
-
224
-
225
-
226
-
227
-
228
-
229
-
230
-
231
-
232
-
233
-
234
-
235
-
236
-
237
-
238
-
239
-
240
-
241
-
242
-
243
-
244
-
245
-
246
-
247
-
248
-
249
-
250
-
251
-
252
-
253
-
254
-
255
-
256
-
257
-
258
-
259
-
260
-
261
-
262
-
263
-
264
-
265
-
266
-
267
-
268
-
269
-
270
-
271
-
272
-
273
-
274
-
275
-
276
-
277
-
278
-
279
-
280
-
281
-
282
-
283
-
284
-
285
-
286
-
287
-
288
-
289
-
290
-
291
-
292
-
293
-
294
-
295
-
296
 |
 |
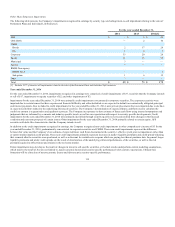
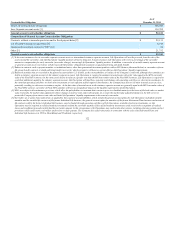
Capitalization
The capital structure of The Hartford as of December 31, 2014 and 2013 consisted of debt and stockholders’ equity, summarized as follows:
Short-term debt (includes current maturities of long-term debt) $ 456 $ 200 128 %
Short-term due on revolving credit facility — 238 (100)%
Long-term debt 5,653 6,106 (7)%
Stockholders’ equity excluding accumulated other comprehensive income (loss), net of tax (“AOCI”) 17,792 18,984 (6)%
AOCI, net of tax 928 (79) NM
Debt to stockholders’ equity 33% 35%
Debt to capitalization 25% 26%
[1] Total debt of the Company excludes $71 and $84 of consumer notes as of December 31, 2014 and December 31, 2013, respectively.
The Hartford’s total capitalization decreased $620 million, or 2%, from December 31, 2014 to December 31, 2013 primarily due to decreases in total debt.
Total stockholders' equity, remained flat from December 31, 2013 to December 31, 2014 due to share repurchases during the period, offset by an increase in
AOCI, primarily due to an increase in net unrealized capital gains from securities.
For additional information AOCI, net of tax, see Note 2 - Business Dispositions and Note 16 - Changes In and Reclassifications From Accumulated Other
Comprehensive Income of Notes to Consolidated Financial Statements, respectively.
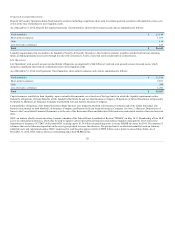
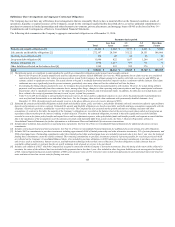
Cash Flow
Net cash provided by operating activities $ 1,886 $ 1,237 $ 2,681
Net provided by (used for) for investing activities $ 1,696 $ 3,745 $ (2,557)
Net cash used for financing activities $ (4,476) $ (5,820) $ (228)
Cash — end of year $ 399 $ 1,428 $ 2,421
Year ended December 31, 2014 compared to the year ended December 31, 2013
Cash provided by operating activities in 2014 reflect an increase in premiums collected and a decrease in loss and loss adjustment expenses paid, partially
offset by an increase in payments for payables and accruals. Operating cash flows for the years ended December 31, 2014, and 2013 have been adequate to
meet liquidity requirements. On June 30, 2014, the Company completed the sale of its Japan annuity business. The operations of this business are reported as
discontinued operations and are primarily in Net cash provided by operating activities. For further information regarding these transactions, see Note 2 -
Business Dispositions of Notes to Consolidated Financial Statements.
Cash used for investing activities in 2014 primarily relates to net proceeds from available-for-sale securities of $2.8 billion, and proceeds from the business
sold of $963, partially offset by net payments for short-term investments of $1.8 billion. Cash used for investing activities in 2013 primarily relates to net
proceeds from the sale of available-for-sale securities of $4.9 billion, and proceeds from the business sold of $815, partially offset by net payments on
derivatives of $2.2 billion.
Cash used for financing activities in 2014 primarily relates to $2.2 billion related to net activity for investment and universal life products, and acquisition of
treasury stock of $1.8 billion. Cash used for financing activities in 2013 primarily consists of net outflows on investment and universal life-type contracts of
$2.1 billion, decrease in securities loaned or sold under agreements to repurchase of $1.9 billion, repayment of long term debt of $ 1.3 billion and treasury
stock acquired of $600.
Year ended December 31, 2013 compared to the year ended December 31, 2012
Cash provided by operating activities decreased primarily due to realized capital losses of $1.5 billion in 2013, compared to an increase in income taxes
received of $486 in 2012.
124