The Hartford 2014 Annual Report Download - page 92
Download and view the complete annual report
Please find page 92 of the 2014 The Hartford annual report below. You can navigate through the pages in the report by either clicking on the pages listed below, or by using the keyword search tool below to find specific information within the annual report.-
 1
1 -
2
-
3
-
4
-
5
-
6
-
7
-
8
-
9
-
10
-
11
-
12
-
13
-
14
-
15
-
16
-
17
-
18
-
19
-
20
-
21
-
22
-
23
-
24
-
25
-
26
-
27
-
28
-
29
-
30
-
31
-
32
-
33
-
34
-
35
-
36
-
37
-
38
-
39
-
40
-
41
-
42
-
43
-
44
-
45
-
46
-
47
-
48
-
49
-
50
-
51
-
52
-
53
-
54
-
55
-
56
-
57
-
58
-
59
-
60
-
61
-
62
-
63
-
64
-
65
-
66
-
67
-
68
-
69
-
70
-
71
-
72
-
73
-
74
-
75
-
76
-
77
-
78
-
79
-
80
-
81
-
 82
82 -
 83
83 -
 84
84 -
 85
85 -
 86
86 -
 87
87 -
 88
88 -
 89
89 -
 90
90 -
 91
91 -
 92
92 -
 93
93 -
 94
94 -
 95
95 -
 96
96 -
 97
97 -
 98
98 -
 99
99 -
 100
100 -
 101
101 -
 102
102 -
103
-
104
-
105
-
106
-
107
-
108
-
109
-
110
-
111
-
112
-
113
-
114
-
115
-
116
-
117
-
118
-
119
-
120
-
121
-
122
-
123
-
124
-
125
-
126
-
127
-
128
-
129
-
130
-
131
-
132
-
133
-
134
-
135
-
136
-
137
-
138
-
139
-
140
-
141
-
142
-
143
-
144
-
145
-
146
-
147
-
148
-
149
-
150
-
151
-
152
-
153
-
154
-
155
-
156
-
157
-
158
-
159
-
160
-
161
-
162
-
163
-
164
-
165
-
166
-
167
-
168
-
169
-
170
-
171
-
172
-
173
-
174
-
175
-
176
-
177
-
178
-
179
-
180
-
181
-
182
-
183
-
184
-
185
-
186
-
187
-
188
-
189
-
190
-
191
-
192
-
193
-
194
-
195
-
196
-
197
-
198
-
199
-
200
-
201
-
202
-
203
-
204
-
205
-
206
-
207
-
208
-
209
-
210
-
211
-
212
-
213
-
214
-
215
-
216
-
217
-
218
-
219
-
220
-
221
-
222
-
223
-
224
-
225
-
226
-
227
-
228
-
229
-
230
-
231
-
232
-
233
-
234
-
235
-
236
-
237
-
238
-
239
-
240
-
241
-
242
-
243
-
244
-
245
-
246
-
247
-
248
-
249
-
250
-
251
-
252
-
253
-
254
-
255
-
256
-
257
-
258
-
259
-
260
-
261
-
262
-
263
-
264
-
265
-
266
-
267
-
268
-
269
-
270
-
271
-
272
-
273
-
274
-
275
-
276
-
277
-
278
-
279
-
280
-
281
-
282
-
283
-
284
-
285
-
286
-
287
-
288
-
289
-
290
-
291
-
292
-
293
-
294
-
295
-
296
 |
 |

Reinsurance Recoverables
Reinsurance Security
To manage reinsurer credit risk, a reinsurance security review committee evaluates the credit standing, financial performance, management and operational
quality of each potential reinsurer. Through this process, the Company maintains a centralized list of reinsurers approved for participation in reinsurance
transactions. Only reinsurers approved through this process are eligible to participate in new reinsurance transactions. The Company's approval designations
reflect the differing credit exposure associated with various classes of business. Participation eligibility is categorized based upon the nature of the risk
reinsured, including the expected liability payout duration. In addition to defining participation eligibility, the Company regularly monitors credit risk
exposure to each reinsurance counterparty and has established limits tiered by counterparty credit rating. For further discussion on how the Company
manages and mitigates third party credit risk, see MD&A - Enterprise Risk Management, Credit Risk.
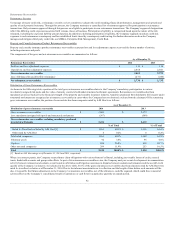
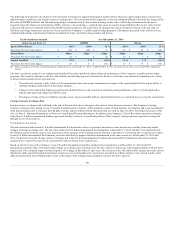
Property and Casualty Insurance Product Reinsurance Recoverables
Property and casualty insurance product reinsurance recoverables represent loss and loss adjustment expense recoverables from a number of entities,
including reinsurers and pools.
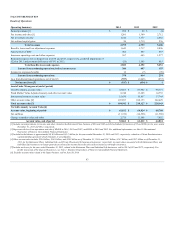
The components of the gross and net reinsurance recoverables are summarized as follows:
Paid loss and loss adjustment expenses $ 133 $ 138
Unpaid loss and loss adjustment expenses 2,868 2,841
Less: Allowance for uncollectible reinsurance (271) (244)
Distribution of Gross Reinsurance Recoverables
As shown in the following table, a portion of the total gross reinsurance recoverables relates to the Company’s mandatory participation in various
involuntary assigned risk pools and the value of annuity contracts held under structured settlement agreements. Reinsurance recoverables due from
mandatory pools are backed by the financial strength of the property and casualty insurance industry. Annuities purchased from third-party life insurers under
structured settlements are recognized as reinsurance recoverables in cases where the Company has not obtained a release from the claimant. Of the remaining
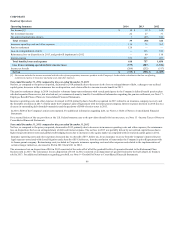
gross reinsurance recoverables, the portion of recoverables due from companies rated by A.M. Best is as follows:
Gross reinsurance recoverables $ 3,001 $ 2,979
Less: mandatory (assigned risk) pools and structured settlements (567)
(569)
Rated A- (Excellent) or better by A.M. Best [1] $ 1,561 64.1% $ 1,558 64.6%
Other rated by A.M. Best 4 0.2% 4 0.2%
Total rated companies 1,565 64.3% 1,562 64.8%
Voluntary pools 92 3.8% 96 4.0%
Captives 488 20.0% 499 20.7%
Other not rated companies 289 11.9% 253 10.5%
[1] Based on A.M. Best ratings as of December 31, 2014 and 2013, respectively.
Where its contracts permit, the Company secures future claim obligations with various forms of collateral, including irrevocable letters of credit, secured
trusts, funds held accounts and group wide offsets. As part of its reinsurance recoverable review, the Company analyzes recent developments in commutation
activity between reinsurers and cedants, recent trends in arbitration and litigation outcomes in disputes between cedants and reinsurers and the overall credit
quality of the Company’s reinsurers. As indicated in the above table, 64.1% of the gross reinsurance recoverables due from reinsurers rated by A.M. Best were
rated A- (excellent) or better as of December 31, 2014. Due to the inherent uncertainties as to collection and the length of time before such amounts will be
due, it is possible that future adjustments to the Company’s reinsurance recoverables, net of the allowance, could be required, which could have a material
adverse effect on the Company’s consolidated results of operations or cash flows in a particular quarterly or annual period.
92