The Hartford 2014 Annual Report Download - page 127
Download and view the complete annual report
Please find page 127 of the 2014 The Hartford annual report below. You can navigate through the pages in the report by either clicking on the pages listed below, or by using the keyword search tool below to find specific information within the annual report.-
 1
1 -
2
-
3
-
4
-
5
-
6
-
7
-
8
-
9
-
10
-
11
-
12
-
13
-
14
-
15
-
16
-
17
-
18
-
19
-
20
-
21
-
22
-
23
-
24
-
25
-
26
-
27
-
28
-
29
-
30
-
31
-
32
-
33
-
34
-
35
-
36
-
37
-
38
-
39
-
40
-
41
-
42
-
43
-
44
-
45
-
46
-
47
-
48
-
49
-
50
-
51
-
52
-
53
-
54
-
55
-
56
-
57
-
58
-
59
-
60
-
61
-
62
-
63
-
64
-
65
-
66
-
67
-
68
-
69
-
70
-
71
-
72
-
73
-
74
-
75
-
76
-
77
-
78
-
79
-
80
-
81
-
82
-
83
-
84
-
85
-
86
-
87
-
88
-
89
-
90
-
91
-
92
-
93
-
94
-
95
-
96
-
97
-
98
-
99
-
100
-
101
-
102
-
103
-
104
-
105
-
106
-
107
-
108
-
109
-
110
-
111
-
112
-
113
-
114
-
115
-
116
-
 117
117 -
 118
118 -
 119
119 -
 120
120 -
 121
121 -
 122
122 -
 123
123 -
 124
124 -
 125
125 -
 126
126 -
 127
127 -
 128
128 -
 129
129 -
 130
130 -
 131
131 -
 132
132 -
 133
133 -
 134
134 -
 135
135 -
 136
136 -
 137
137 -
138
-
139
-
140
-
141
-
142
-
143
-
144
-
145
-
146
-
147
-
148
-
149
-
150
-
151
-
152
-
153
-
154
-
155
-
156
-
157
-
158
-
159
-
160
-
161
-
162
-
163
-
164
-
165
-
166
-
167
-
168
-
169
-
170
-
171
-
172
-
173
-
174
-
175
-
176
-
177
-
178
-
179
-
180
-
181
-
182
-
183
-
184
-
185
-
186
-
187
-
188
-
189
-
190
-
191
-
192
-
193
-
194
-
195
-
196
-
197
-
198
-
199
-
200
-
201
-
202
-
203
-
204
-
205
-
206
-
207
-
208
-
209
-
210
-
211
-
212
-
213
-
214
-
215
-
216
-
217
-
218
-
219
-
220
-
221
-
222
-
223
-
224
-
225
-
226
-
227
-
228
-
229
-
230
-
231
-
232
-
233
-
234
-
235
-
236
-
237
-
238
-
239
-
240
-
241
-
242
-
243
-
244
-
245
-
246
-
247
-
248
-
249
-
250
-
251
-
252
-
253
-
254
-
255
-
256
-
257
-
258
-
259
-
260
-
261
-
262
-
263
-
264
-
265
-
266
-
267
-
268
-
269
-
270
-
271
-
272
-
273
-
274
-
275
-
276
-
277
-
278
-
279
-
280
-
281
-
282
-
283
-
284
-
285
-
286
-
287
-
288
-
289
-
290
-
291
-
292
-
293
-
294
-
295
-
296
 |
 |

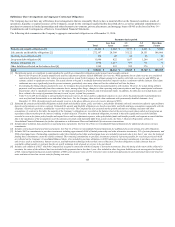
The Company’s stockholders’ equity, as prepared using U.S. generally accepted accounting principles (“U.S. GAAP”) was $18.7 billion as of December 31,
2014. The Company’s estimated aggregate statutory capital and surplus, as prepared in conformity with statutory accounting practices prescribed or
permitted by the applicable state insurance department (“U.S. STAT”) was $15.2 billion as of December 31, 2014. Significant differences between U.S. GAAP
stockholders’ equity and aggregate statutory capital and surplus prepared in accordance with U.S. STAT include the following:
• U.S. STAT excludes equity of non-insurance and foreign insurance subsidiaries not held by U.S. insurance subsidiaries.
• Costs incurred by the Company to acquire insurance policies are deferred under U.S. GAAP while those costs are expensed immediately under U.S.
STAT.
• Temporary differences between the book and tax basis of an asset or liability which are recorded as deferred tax assets are evaluated for
recoverability under U.S. GAAP while those amounts deferred are subject to limitations under U.S. STAT.
• The assumptions used in the determination of Life benefit reserves is prescribed under U.S. STAT, while the assumptions used under U.S. GAAP are
generally the Company’s best estimates. The methodologies for determining life insurance reserve amounts may also be different. For example,
reserving for living benefit reserves under U.S. STAT is generally addressed by the Commissioners’ Annuity Reserving Valuation Methodology and
the related Actuarial Guidelines, while under U.S. GAAP, those same living benefits may be considered embedded derivatives and recorded at fair
value or they may be considered SOP 03-1 reserves. The sensitivity of these life insurance reserves to changes in equity markets, as applicable, will
be different between U.S. GAAP and U.S. STAT.
• The difference between the amortized cost and fair value of fixed maturity and other investments, net of tax, is recorded as an increase or decrease to
the carrying value of the related asset and to equity under U.S. GAAP, while U.S. STAT only records certain securities at fair value, such as equity
securities and certain lower rated bonds required by the NAIC to be recorded at the lower of amortized cost or fair value.
• U.S. STAT for life insurance companies establishes a formula reserve for realized and unrealized losses due to default and equity risks associated
with certain invested assets (the Asset Valuation Reserve), while U.S. GAAP does not. Also, for those realized gains and losses caused by changes in
interest rates, U.S. STAT for life insurance companies defers and amortizes the gains and losses, caused by changes in interest rates, into income over
the original life to maturity of the asset sold (the Interest Maintenance Reserve) while U.S. GAAP does not.
• Goodwill arising from the acquisition of a business is tested for recoverability on an annual basis (or more frequently, as necessary) for U.S. GAAP,
while under U.S. STAT goodwill is amortized over a period not to exceed 10 years and the amount of goodwill admitted as an asset is limited.
In addition, certain assets, including a portion of premiums receivable and fixed assets, are non-admitted (recorded at zero value and charged against surplus)
under U.S. STAT. U.S. GAAP generally evaluates assets based on their recoverability.
The Company's U.S. insurance companies' states of domicile impose risk-based capital (“RBC”) requirements. The requirements provide a means of
measuring the minimum amount of statutory capital and surplus (referred to collectively as "capital") appropriate for an insurance company to support its
overall business operations, based on its size and risk profile. Regulatory compliance is determined by a ratio of a company's total adjusted capital (“TAC”)
to its authorized control level RBC (“ACL RBC”). Companies below specific trigger points or ratios are classified within certain levels, each of which
requires specified corrective action. The minimum level of TAC before corrective action commences (“Company Action Level”) is two times the ACL RBC.
The adequacy of a company's capital is determined by the ratio of a company's TAC to its Company Action Level, known as the "RBC ratio". All of the
Company's operating insurance subsidiaries had RBC ratios in excess of the minimum levels required by the applicable insurance regulations. On an
aggregate basis, The Company's U.S. property and casualty insurance companies' RBC ratio was in excess of 200% of its Company Action Level as of
December 31, 2014 and 2013. The RBC ratios for the Company's principal life insurance operating subsidiaries were all in excess of 425% of their respective
Company Action Levels as of December 31, 2014 and 2013. The reporting of RBC ratios is not intended for the purpose of ranking any insurance company,
or for use in connection with any marketing, advertising or promotional activities.
Similar to the RBC ratios that are employed by U.S. insurance regulators, regulatory authorities in the international jurisdictions in which The Company
operates generally establish minimum solvency requirements for insurance companies. All of The Hartford's international insurance subsidiaries have
solvency margins in excess of the minimum levels required by the applicable regulatory authorities.
127